How the budget simulator works: data and model
Published: 2026-06-14
How /budget/simulator works: where the data comes from and how the model is built. Static and dynamic mode, how every lever is scored (VAT, income tax, corporate, dividends, the social-security cap, excise, spending), the behavioral elasticities and fiscal multipliers behind dynamic mode, the limitations and the validation against official costings.
What would 9% VAT on food cost? How much does removing the social-security cap raise? And what is left of those numbers once people change their behavior? Every Bulgarian tax debate eventually lands on these questions — and the answers arrive piecemeal: a ministry press release, a union opinion, a back-of-the-envelope expert estimate. Rarely in one place. Even more rarely with a shared methodology and sources anyone can check.
The budget simulator puts all of it on one screen: move a rate and see, side by side, what happens to consolidated budget revenue per year and to one worked payslip per month. You can cost real proposals — a progressive tax, higher VAT, contributions without a cap, higher tobacco excise, a gambling levy, pricier road charges, defense at 3% of GDP — and compare them against the published official estimates. The code is open and the assumptions are spelled out one by one.
There's also a faster way in: pick a whole country. A row of flag chips — Estonia, Poland, Hungary, Germany, France, Sweden, Ireland, Greece — snaps every comparable lever at once to that country's real policy (VAT, the income-tax schedule, corporate and defense levels, pension indexation and excise duties), so you can see what Bulgaria's budget and your own payslip would look like under, say, Estonia's flat tax or Poland's defense spend. It's the mirror image of the per-lever "like in…" buttons — every value sourced the same way (PwC, the Tax Foundation excise tables, the NATO compendium) — and levers with no clean cross-country analogue stay at Bulgarian law.
Two modes: static and dynamic
The simulator scores every scenario two ways, toggled with one button.

Static mode holds the tax base at the latest closed fiscal year (the 2025 execution) and assumes people do not change behavior. This is the convention of official costings — when the Ministry of Finance says "+1pp VAT = +X", it computes exactly that: the current base times the new rate. The approach is reasonable for small moves and useful precisely because it is comparable to the official figures.
Dynamic mode (the default) adds what static omits: people respond to taxes. It layers three things — behavioral responses of the tax base (reporting, profit shifting, compliance), a reduced-form macroeconomic feedback on GDP, and a Monte-Carlo uncertainty band. The result is a more conservative but more honest estimate: a tax hike almost always yields less than the static figure.
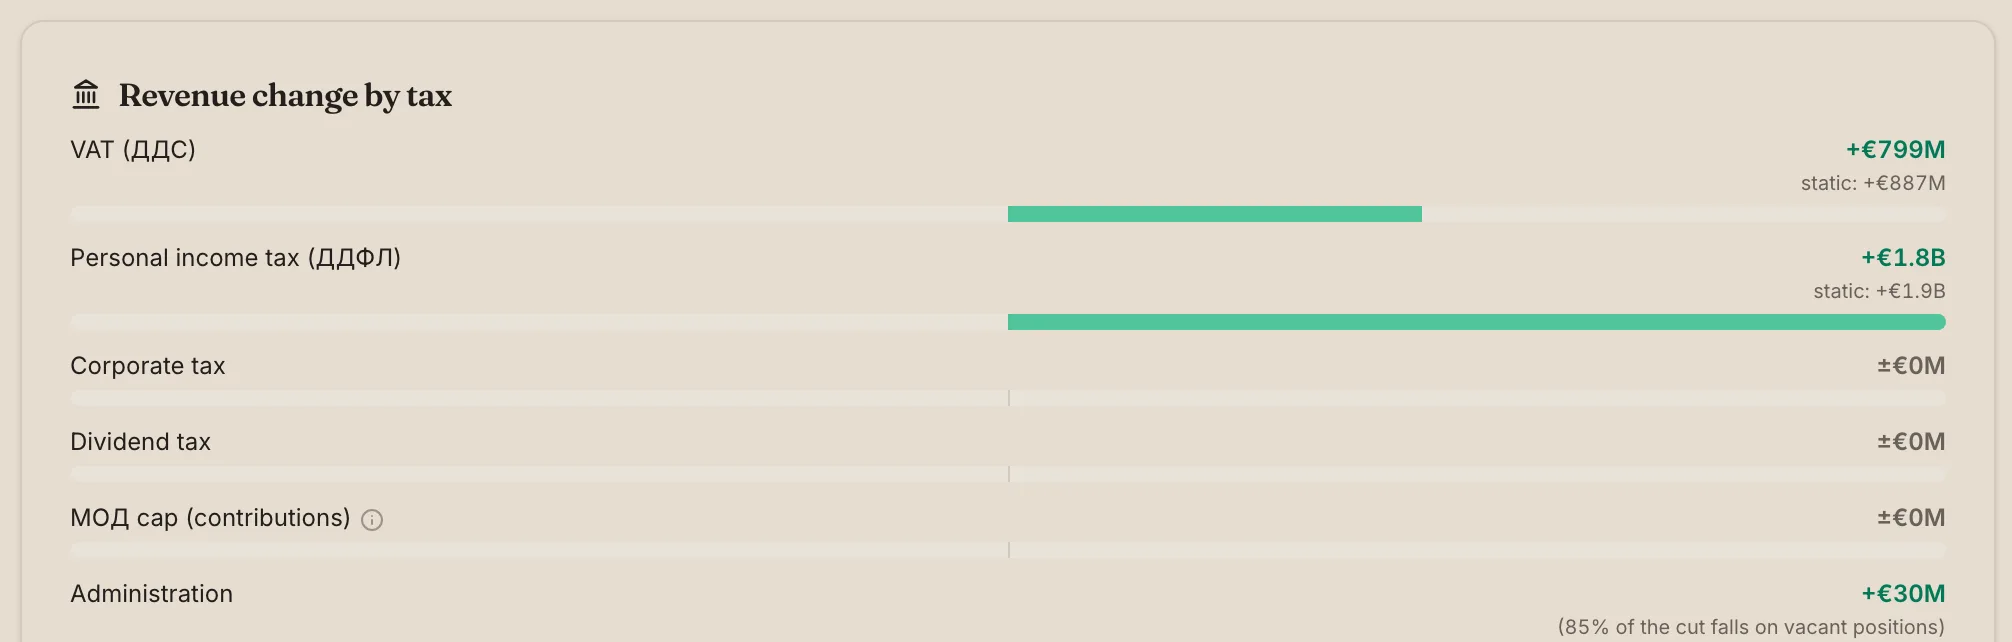
The big "Budget balance effect" figure combines both modes: it shows the dynamic central estimate, the uncertainty band (5th to 95th percentile), and a "static X · behavior −Y" decomposition — so you see both the static figure and how much the behavioral response eats.

The goal: what you're actually trying to achieve
Above the numbers sits a scoreboard with three missions that turn the abstract result into a target:
- Maastricht −3% — bring the deficit under 3% of GDP for 2026; precisely the threshold behind the European Commission's recommendation to open an excessive-deficit procedure against Bulgaria on 3 June 2026.[^edp]
- Debt under 40% by 2030 — keep government debt below 40% of GDP at the end of the projection (the baseline drifts to ~43%).
- Defense 3% — reach 3% of GDP on defense without a first-year deficit worse than the baseline.
The gauge shows where the deficit is "today", where your scenario takes it, and where the finish line is — like the budget-balancing games of the US Committee for a Responsible Federal Budget. The number no longer floats; it moves toward a goal.
Couldn't the deficit just be covered from the BNB's currency reserve instead of taxes and cuts? It's a common expectation — but the reserve is not a state piggy bank, and the euro does not "free it up". We explain why in a separate analysis — which is why, in the simulator, the deficit moves only through the revenue and spending levers.
Built a scenario that brings the deficit under 3%? Share it in the Наясно Facebook group — we're curious which lever you pull first.
How each lever is scored
This is the heart of the simulator. Every lever has its own methodology, and every number traces to КФП execution, the НАП annual report, Eurostat national accounts or the НОИ aggregates.
VAT. The model rides on Eurostat household final consumption by COICOP purpose[^coicop]: each consumption slice carries its statutory VAT regime (standard 20%, reduced 9% or zero), and the gap between modeled and actual VAT revenue (households are only part of the base) is bridged by a calibration factor that is stable around 1.17 across 2021–2025. A +1pp move in the standard rate yields ≈ +€447M. For context: Bulgaria's VAT compliance gap is estimated at €781M — 8.6% of the theoretical liability in the EC's 2025 edition.[^vatgap]
Income tax — flat rate, tax-free minimum, progression. This is where the model does the most statistical work. The wage distribution is assembled from real anchors — the decile ratios in Eurostat's Structure of Earnings Survey, SES 2022[^ses], the НОИ average insurable income, and the real НАП table of declared incomes by bracket for 2023[^naptiers] — with statistics filling in only what no institution publishes regularly in machine-readable form: the scale between the anchors and the Pareto tail for the top incomes. The resulting distribution passes three checks. First: at the current flat 10% it reproduces the real НАП employment-PIT line exactly (calibration coefficient κ = 1.00). Second: applied retroactively to the legislated 2025 cap raise, it gives €113M against the Ministry of Finance's own €128M estimate. Third: the cumulative mass across the НАП brackets matches to within 8 percentage points, and the tail ordering comes out right. The tax-free minimum, the progressive brackets and cap moves in both directions are scored over this distribution.
Corporate and dividend tax. Both are flat (10% and 5%) and in static mode scale linearly off the executed budget line. Here the model is most cautious: at a higher corporate rate the real revenue is almost certainly overstated, because the low 10% rate leads multinational groups to book in Bulgaria profits earned elsewhere, and a higher rate would push part of that base back out. Dynamic mode applies a behavioral correction precisely for this — and for dividends it is calibrated to the only published Bulgarian behavioral estimate: a 5%→10% rise yields +€75M static but ≈ +€45M dynamic, within the Fiscal Council's ≤€50M ceiling.[^fs]
Maximum insurable income (МОД). The social-security cap (now €2,111.64) is a special case: the wage mass above the cap is recovered from the accounting gap between the uncapped PIT base and the capped insurable base, plus a Pareto tail for the distribution above the cap. Because the tail is uncertain, this lever alone carries an explicit uncertainty band on the result.
Excise duties. This is one of the biggest tax lines — over €3.8B in 2025, more than corporate tax. Here you change the rate of each product, with the values in force in Bulgaria as the defaults: diesel and petrol in €/1000 L, cigarettes in €/1000, spirits in €/hl of pure alcohol, wine in €/hl. Next to every slider there's a "like in…" button you can use to set it to a chosen EU country's rate. The bases come straight from the Customs Agency annual chronicle: fuel ≈ €1.44B, tobacco ≈ €2.15B, alcohol ≈ €177M in 2025.[^excise] Where Bulgaria sits: diesel (€330/1000L) is exactly at the EU floor, and petrol (€363/1000L) a step above its €359 floor, so neither has legal room to fall; cigarettes are at ~€114/1000, just above the EU floor (€90/1000 and ≥60% of the weighted-average retail price), with a legislated climb toward 2029; spirits at €562/hl, just above the €550 floor; wine at €0 (the EU floor is also 0, so introducing one is a legal choice). For scale, the "like in…" buttons show how much higher the rest of the EU taxes: cigarettes — €535/1000 in Ireland vs €195 in Germany; spirits — ~€4,775/hl in Sweden vs €1,303 in Germany; wine — €425/hl in Ireland, while France levies a token €4. The behavioral correction matters most for tobacco: a steep hike pushes the market to illicit and cross-border trade — as in 2009–2010, when the illicit share jumped from 17.5% to nearly 40% — so a big increase can even shrink revenue.
Gambling. The lever moves the Gambling Act variable fee on gross gaming revenue (GGR — stakes minus payouts) for betting, lotteries and online play. The default is 25% — the rate in force from 2026, raised from 20%. Gambling is an alternative tax buried in the "Corporate tax"/"Other taxes" line plus fees, so there is no standalone budget line — the base (GGR ≈ €716M in 2025) is НАП/industry-reported, not a published government figure.[^gambling] We deliberately leave the fixed per-machine and per-table casino tax out of the model (it's device count × fixed fee, and for the count we only have a rough anchor). The behavioral correction is the same as for corporate tax: raise the rate and the licensed base starts drifting to unlicensed and offshore operators (51 licensed online operators compete with the offshore market), with a Laffer turn on a large hike.
Road charges. Bulgaria's e-vignettes (cars up to 3.5 t) and the per-kilometre toll for heavy vehicles are collected by the Road Infrastructure Agency into the republican budget — about €562M in 2025 (≈ 1.1 billion BGN), up from €459.7M in 2024 (of which €144M e-vignettes and €302M toll).[^roadcharges] The lever applies a single percentage uplift to that combined base; the default is 0 (no change). It's the kind of measure that surfaces in every consolidation package: the caretaker "Radev" 2026 budget framework proposed a +30% vignette rise worth ≈ €53M — a subset of this lever, which scales the whole ≈ €180M vignette / ≈ €380M toll base together. Car vignettes are near-inelastic (you have to use the network to drive), but the heavy-vehicle toll loses some base to cross-border diversion at higher rates, so the behavioral correction is modest. Like gambling, this is an administrative АПИ/НТУ figure rather than a clean КФП tax line.
Expenditure levers. The simulator also scores the spending side: pension indexation under the Swiss rule (CPI weight vs insurable-income growth), administration cuts (where vacant positions absorb the cut first and save almost nothing in cash), a minimum-wage freeze, a NATO-definition defense target, capital spending (through the historical execution rate), the health contribution, the minimum pension, public-sector wages, and several levers from the live budget debate (maternity, MP pay, party subsidies).
Public-sector employees' contributions are a lever with a legal quirk. Under art. 6(5) of the Social Security Code the budget pays both contribution shares — the employer's and the employee's — for about 133 thousand people: civil servants, the judiciary, the military, МВР and the special services (the sum of the two НОИ categories in the 2024 statistics).[^kso] The lever shifts the standard 13.78% employee share onto them, as every other employee pays; the elevated special-category rates stay budget-paid either way. There is a tax wrinkle too: because nothing is withheld from them today, their income-tax base is the full gross — after the shift the personal contributions become deductible and the budget gives a little income tax back. The Fiscal Council prices shifting the employee share for civil servants and the judiciary (excl. МВР) at around 200 млн лв (≈ €102M) a year, with a "much larger effect" from the police and the military[^fspers]; at full scope the model gives about €254M without compensation — and zero if salaries are grossed up, the realistic scenario.
Every wage lever pays itself partly back. When the budget raises (or cuts) pay, it also collects (or loses) the PIT and social contributions on that pay — roughly 30.6% of the change comes straight back. This mechanical feedback applies to every lever that moves wages — administration cuts, public-sector wage indexation, the teachers' 125% peg — so a wage rise costs the budget materially less than its gross price tag (a +5% public-wage indexation nets ≈ €98M, not ≈ €142M). Under the consolidated-budget frame the employer contribution nets out — the budget both pays and receives it — leaving exactly the genuine cost. This is an accounting offset, not a behavioral guess: it sits in both static and dynamic mode.
The dynamic layer: behavior and macro feedback
Dynamic mode rests on two tiers, each sourced.
Tier 1 — behavioral base responses. Each lever gets a behavioral correction expressed as an elasticity with a low/central/high band. The correction carries only reporting, shifting and compliance responses — aggregate-demand effects live in Tier 2, to avoid double-counting.
| Parameter | Central (range) | Source |
|---|---|---|
| Elasticity of taxable income — employment | 0.20 (0.10–0.40) | Gruber–Saez (2002); Saez–Slemrod–Giertz (2012)[^eti] |
| Elasticity of taxable income — non-employment | 0.50 (0.30–0.80) | Saez–Slemrod–Giertz (2012)[^eti] |
| Corporate base semi-elasticity, %/pp | 0.8 (0.4–1.5) | de Mooij–Ederveen; Heckemeyer–Overesch (2017)[^cit] |
| Dividend base semi-elasticity, %/pp | 4.5 (3.0–6.5) | calibrated to the Fiscal Council (2025)[^fs] |
| VAT — share lost to compliance | 0.10 (0.03–0.20) | EC VAT gap (2025)[^vatgap] |
| Diesel & petrol excise — base leakage, %/pp | 0.10 (0.04–0.25) | demand −0.1…−0.3 + cross-border trade[^excise] |
| Cigarette excise — base leakage, %/pp | 0.25 (0.12–0.60) | EU panel ≈ −0.4 + illicit market 2009–10[^excise] |
| Spirits excise — base leakage, %/pp | 0.25 (0.12–0.50) | spirits −0.5…−0.8 + home production[^excise] |
| Wine excise — leakage on an introduced duty | 0.15 (0.05–0.35) | home/unrecorded wine[^excise] |
| Gambling — GGR base leakage, %/pp | 1.0 (0.5–2.5) | offshore migration; the 2013 episode[^gambling] |
| Road charges — base leakage, %/pp | 0.15 (0.05–0.40) | car vignettes inelastic; heavy-vehicle toll diversion[^roadcharges] |
| Maternity — share returning to work if cut | 0.45 (0.25–0.65) | НСИ maternal-employment gap + КСО чл.54[^matwork] |
| Dividend↔salary relabeling — net recapture | 0.008 (0.0–0.03) | derived; Chetty–Saez (2005)[^chetty] |
Tier 2 — macroeconomic feedback. The fiscal impulse passes through a multiplier onto GDP, and the GDP change comes back as revenue. The multipliers come from the IMF study specific to Bulgaria — _Fiscal Multipliers in Bulgaria: Low But Still Relevant_ (Muir & Weber, 2013)[^imf]: a year-1 tax multiplier of 0.3–0.4 (VAT at the low end), spending ≈ 0. Exactly as the paper concludes — direct taxes and capital spending have the largest effect on output, indirect taxes and non-targeted transfers the smallest — which is why VAT gets the low band. The result: a tax consolidation yields about 13% less in the first year than the static estimate, reproducing the empirical rule that "static revenue gains from tax hikes are overstated by 10–15%".
Monte-Carlo band. For every scenario the model draws 500 times from each parameter's range (plus the Pareto index), with a fixed seed — so the band moves smoothly with the sliders instead of flickering — and reports a 90% interval around the headline.
Second-order effects: when one lever moves another
A policy rarely changes just the line it targets. Cutting a benefit, for instance, sends some recipients back to work — and the taxes they then pay partly offset the saving. The model captures the most material of these knock-on effects, each banded the same way as the elasticities above so it flows through the uncertainty band rather than masquerading as a precise number.
Maternity: a cut also brings in PIT and contributions. Bulgaria's paid second year of leave is among the EU's longest. Cutting it saves the benefit (€154M for the full year), but a share of the affected mothers return to work earlier — and once working they pay income tax and social contributions. So the _true_ saving is larger than the benefit line alone: with a central assumption that 45% return (the band spans 25–65%, reflecting scarce under-3 childcare and the rule that lets a mother keep half the benefit while working), the full-year cut saves about €218M dynamically, not €154M. The direction matters as much as the number: the static figure _understates_ the saving here, the opposite of a tax hike.
Dividends and salary are substitutes. Raising the dividend tax pushes some owner-managers to take income as salary instead, where it is taxed differently. We credit the net budget recapture on that relabeled sliver — but deliberately keep it small and bounded: most of the dividend-base response is profit-retention and payout-timing rather than salary relabeling, and dividend income concentrates above the contributions cap, where shifting to salary is roughly neutral (the 10% income tax on the salary is offset by the corporate tax the company saves by deducting it). For the 5%→10% scenario this adds only a few million euro, and it rides its own line — so the Fiscal Council dividend calibration is untouched.
Health-contribution deductibility. Raising the health contribution collects more, but the employee's share of it is deductible from the income-tax base — so the budget gives a little income tax back (about 4% of the gross). Small, but it is the same deduction interaction the МОД lever models, applied consistently throughout.
These are the cases where the offset is large enough to matter and defensible enough to source. Others — defense procurement and capital projects generating wages and VAT — are left to the Tier-2 macro multiplier rather than double-counted as a direct feedback.
Who gains, who loses
A single average hides the distribution. The simulator reveals it two ways.
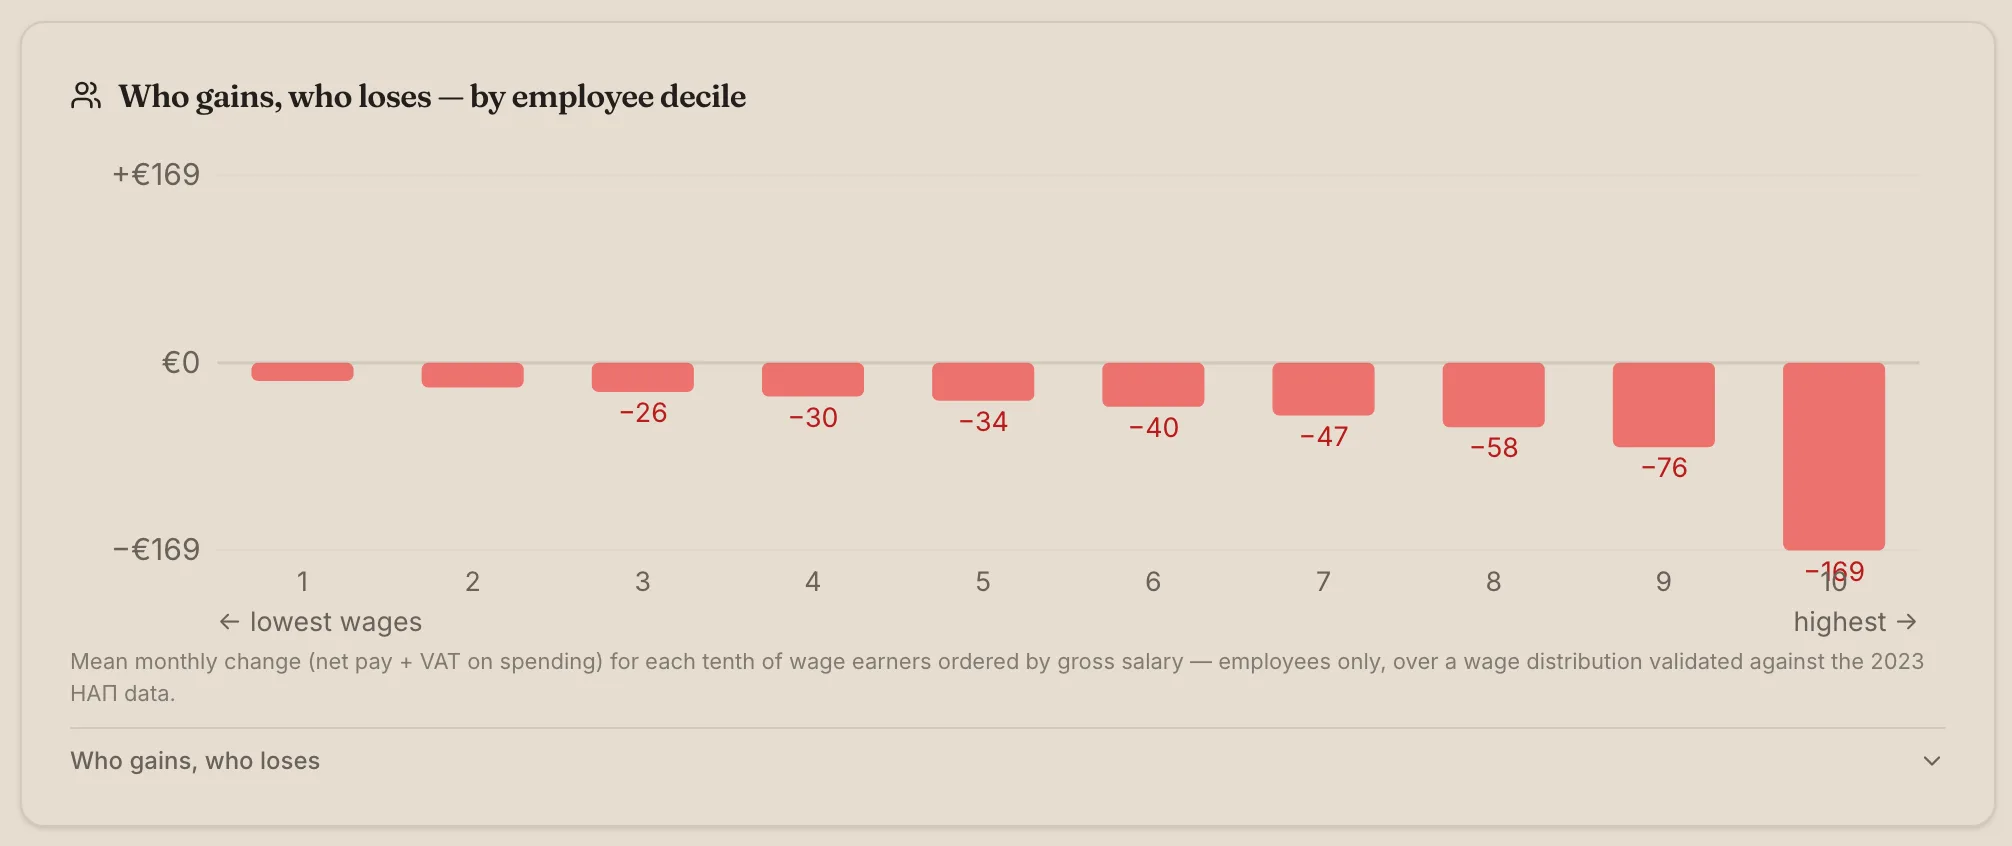
The winners-and-losers strip shows the mean monthly change (net pay + VAT on spending) for each tenth of wage earners, ordered by gross salary — you instantly see whether a measure is progressive or regressive. Below it the tool reports the Gini coefficient before and after.
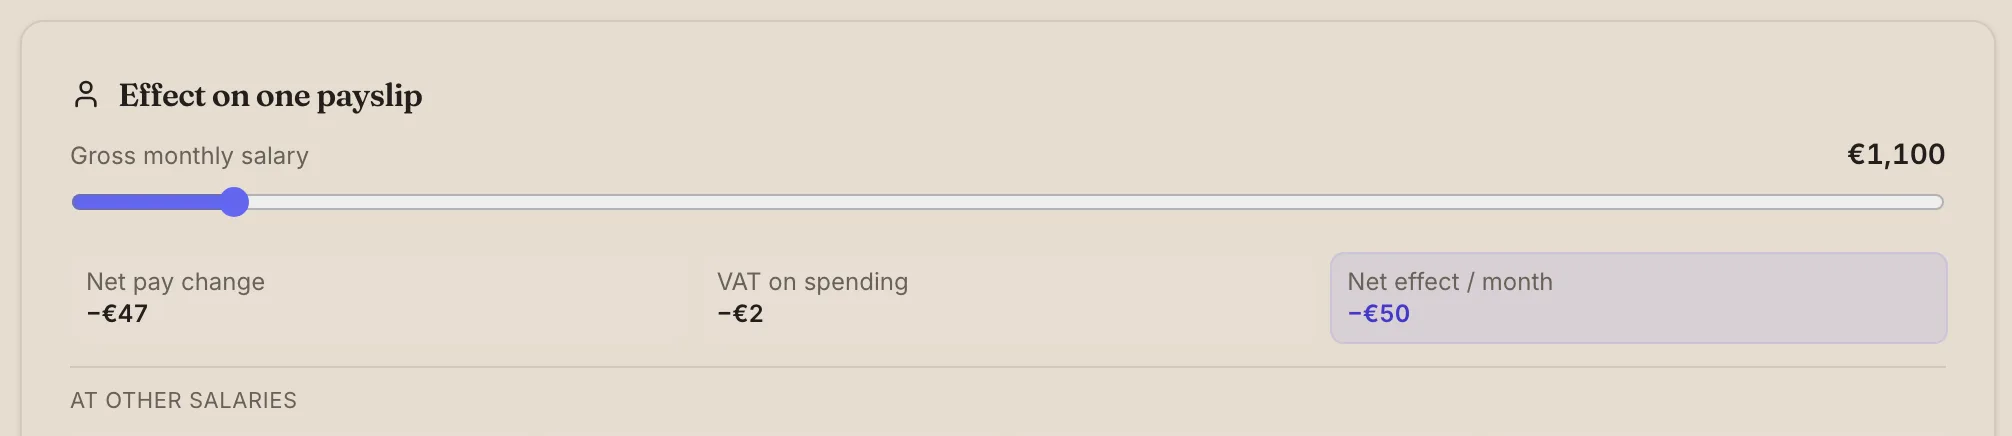
The one-payslip panel translates the scenario to a personal level: at a chosen gross salary it shows the net effect, the VAT-on-spending effect and the total, plus ready exemplars for a minimum, average, high and above-cap salary.
The five-year projection
The headline is the one-year effect. But deficits and debt accumulate — so the simulator rolls the scenario forward to 2030.
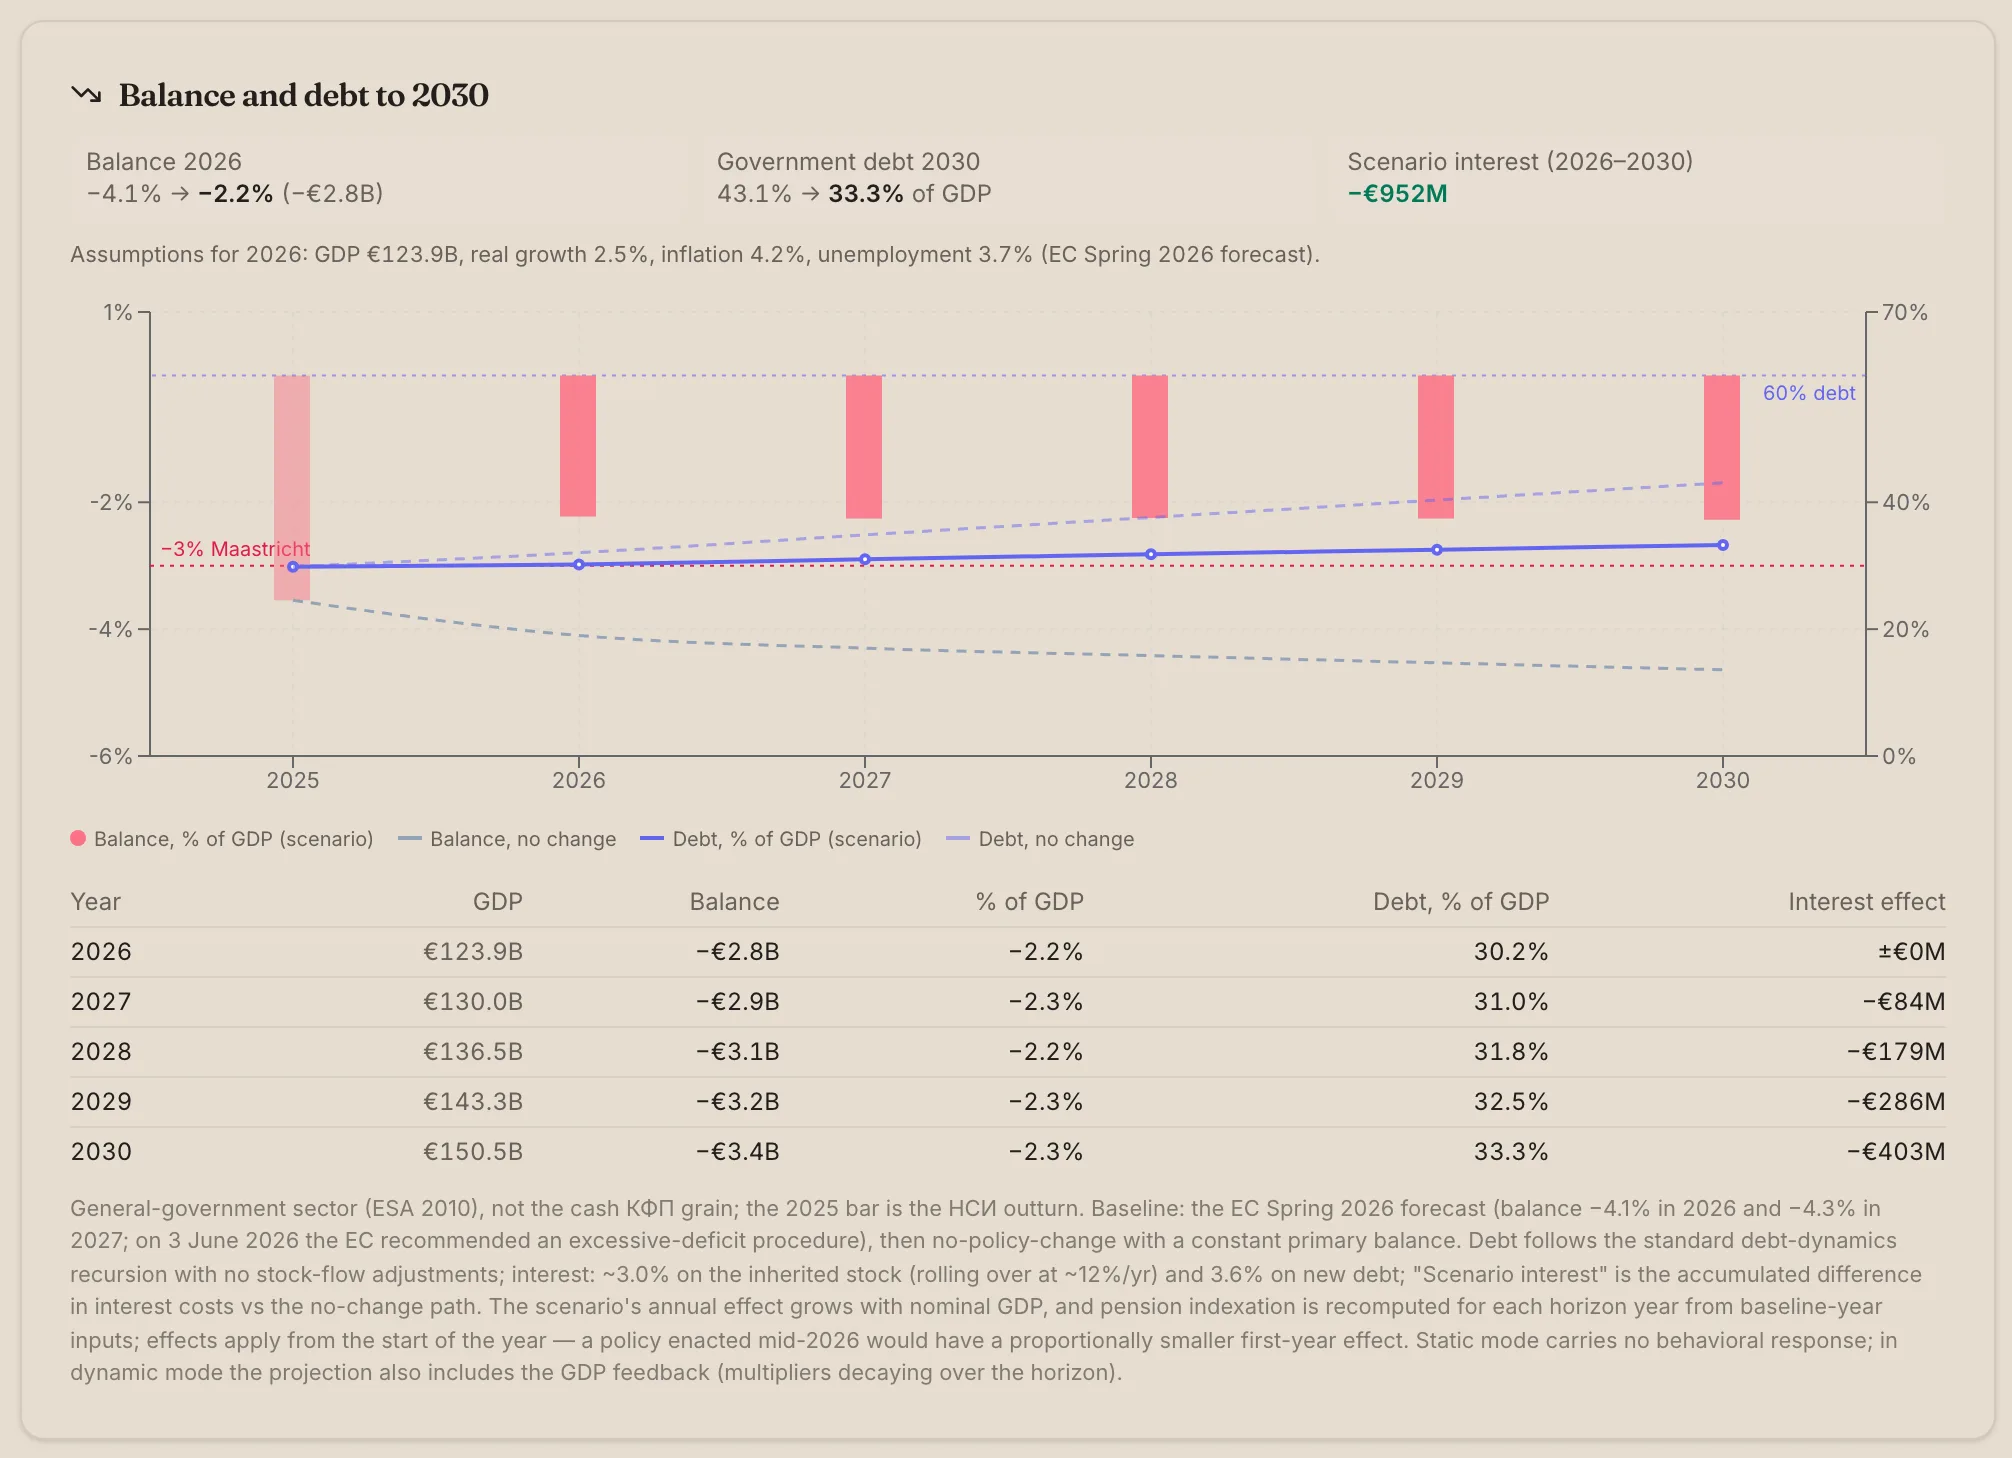
The projection is at the general-government (ESA 2010) grain, not the cash КФП grain of the rest of the screen, because the −3%/60% reference values and the EC forecast are defined there. The 2025 bar is the НСИ outturn (deficit −3.5%, debt 29.9%, GDP €116.0bn)[^nsi]. The baseline rides the EC Spring 2026 forecast (balance −4.1% in 2026 and −4.3% in 2027[^edp]), then holds policy unchanged. Debt follows the standard debt-dynamics recursion with no stock-flow adjustments[^ecb]; interest is modeled in two buckets (inherited debt at ~3.0%, new at ~3.6%). "Scenario interest" is the accumulated difference in interest cost — the compounding cost of servicing the extra debt a loosening scenario issues.
Validation against official estimates
We compared some of the scenarios computed through our simulator against the official estimates published in the media:
| Scenario | Model (static) | Dynamic | Published estimate |
|---|---|---|---|
| Restaurants VAT → 9% | −€286M | −€258M | МФ (2024–25): −€150…−240M/yr; Budget 2025 booked +€238M when restored to 20%[^mf] |
| Food & medicines VAT → 9% | −€1.7B | −€1.4B | МФ (2020): −1.5 млрд лв on the 2020 base — scaled to today's base ≈ −€1.2…−1.3B[^mf2020] |
| Corporate tax +1pp | +€333M | +€304M | МФ (2023): ≈ +€230M/pp (2023 base)[^mf] |
| Corporate tax 10% → 15% | +€1.7B | +€1.3B | КНСБ (2025): ≈ +€1.1B[^knsb] |
| Dividend tax 5% → 10% | +€75M | +€45M | Fiscal Council (2025): up to +€50M (with behavioral response)[^fs] |
| Health contribution +1pp | +€302M | +€287M | КНСБ/НОИ (2025): ≈ +€300M/pp[^knsb] |
| МОД cap €2,112 → €2,352 | +€147M | +€133M | КНСБ (2025): ≈ +€180M for ДОО (≈ +€230M all contributions)[^knsb] |
| Tax-free minimum €620/mo | −€1.9B | −€1.9B | ≈ −€1.9B (scaled from a 2022 estimate for 500 лв) |
| Pensions: CPI-only indexation | +€479M | +€470M | НОИ (06.2026): the July Swiss-rule indexation (7.8%) costs ≈ €513M through end-2026 — ≈ €1.0–1.1B annualized; CPI-only would save roughly half[^noi2026] |
| Civil servants pay own contributions | +€254M (full scope) | +€249M | Fiscal Council (2026): ≈ 200 млн лв (≈ €102M) for civil servants + judiciary only (excl. МВР); "much larger effect" with police and military (state covers 73.3%) — the model's full scope includes them[^fspers] |
| Party subsidy €4.09 → €3.00 | +€3M/yr | +€3M | Sponsors (06.2026): ≈ +€2.2M for 2026 — in force since 30 April, i.e. ≈ €3.3M annualized[^psub2026] |
| Gambling — GGR fee 20% → 25% | +€36M | +€28M | Budget 2026 (МФ): ≈ +€32M from the 5 percentage points — between our static and dynamic estimate[^gambling] |
| Road charges — vignettes +30% | +€54M | — | кабинет "Radev" 2026 framework: ≈ +€53M from +30% on vignettes (the ≈ €180M vignette slice of the €562M base); the slider's +30% on the whole base reads €169M[^roadcharges] |
The takeaway: static scoring matches the official _static_ numbers (МФ's own menu is static per-pp on the then-current base). And for the bigger moves — corporate tax at 15%, food and medicines at the reduced rate — it is the dynamic estimate that lands near the published figures: which is why it is the default mode. The clearest case is the dividend: +€75M static vs the Fiscal Council's ≤€50M — precisely because the Council's number embeds a behavioral response, the same one dynamic mode reproduces.
Spotted a discrepancy, or know a better source? Post it in the Наясно group — the methodology improves through exactly this kind of scrutiny.
Limitations and assumptions
No model is reality. Here is where this one's edges are:
- The static base is fixed to the data of the latest closed year. For larger moves the real base shifts — hence dynamic mode. But that too is a simplified model, not a general-equilibrium simulation.
- The wage distribution is the most statistical part of the model. It determines the tax-free minimum, the progressive brackets and МОД. The three checks — κ = 1.00, the МОД backtest and the comparison against the 2023 НАП table — keep it anchored to real data; finer, annual data would shrink the tail uncertainty further.
- Corporate estimates overstate at higher rates (profit shifting), which static mode does not see and dynamic mode captures only partially.
- No general equilibrium, no employment effects beyond the reduced-form multiplier. Second-round effects (wages, prices, investment) are not modeled.
- The behavioral elasticities are from the literature, not Bulgarian estimates — the low/central/high ranges reflect exactly that uncertainty and feed the Monte-Carlo band.
Transparency here is the point, not a claim of euro-level precision. Every assumption is listed, and the code is open.
What we're asking НАП for, and why
The most statistical part of the model is the wage distribution — it drives the estimates for the tax-free minimum, progressive taxation and the social-security cap. Statistics are needed for one reason only: there is no public, machine-readable source for the number of taxpayers by income bracket, refreshed annually.
But a version of this data exists — and has been released. НАП routinely derives it from employers' monthly Form №1 declarations and the annual чл.50 declarations under the Personal Income Tax Act, distributed by annual tax base. The Ministry of Finance has already answered parliamentary questions with exactly this distribution — the number of people and the tax paid, by income group:
- for 2023 — MoF written answer, December 2024[^naptiers];
- for 2012–2016 — written answer by income group;
- for 2019 — written answer by group and category.
The 2023 table is built into the model. It covers 3,109,552 filers, €3.07B of declared ДДФЛ on €30.7B of taxable base — with the top 1.5% (47,630 people above 108,000 лв of base) paying 21.5% of all ДДФЛ. We use it conservatively: to validate the body of the fitted distribution where the two populations coincide (and they coincide well — the cumulative mass through the upper-middle incomes is within 8 percentage points), and to source the tail ordering. There is a subtlety we make explicit: the НАП table is _all_ filers (employees + self-employed + final-tax), while the model scores _wage employees_. So the all-filer tail is fatter (Pareto α ≈ 1.67) than the employee-only tail (α ≈ 2.27) — the top НАП groups blend in dividend and business income. That ordering is the correct one, and the real data confirms it; so we do not overwrite the employee parameters (which drive the МОД lever) — we validate them.
We have filed a request under the Access to Public Information Act (ЗДОИ) for these data to be published as a machine-readable, reusable open dataset, refreshed annually and at finer income brackets — rather than extracted one parliamentary answer at a time from locked PDFs (the MoF site blocks automated access). With such a dataset both the body and the tail become fully source-traceable, the tax-free-minimum / progression / МОД uncertainty shrinks further, and — most importantly — any citizen, journalist or analyst could transparently cost a tax proposal. Better data makes for a better public debate.
Open source and reproducibility
The whole tool is open source at github.com/atanasster/electionsbg. The static scoring engine lives in src/lib/bgTaxPolicy.ts, the dynamic layer in src/lib/bgBehavioral.ts, the five-year projection in src/lib/bgFiscalProjection.ts, and the offline baseline is assembled by scripts/budget/run_policy_baseline.ts. Each part is locked by smoke tests that assert the identities (for example, that at zero elasticity dynamic equals static, and that the dividend lever stays within the Fiscal Council's ceiling). The research notes and full source list are in docs/budget_simulator_grounding.md.
Finally — open the simulator and build your own scenario. You can add it to the public tally ("what the public chose") — voluntarily, with no personal data — and then defend it in the Наясно Facebook group, where we discuss what the data shows and the most interesting scenarios become the next analyses.
[^edp]: European Commission — Spring 2026 economic forecast (Bulgaria), 21 May 2026; recommendation to open an excessive-deficit procedure, 3 June 2026. See the EC Bulgaria page.
[^nsi]: НСИ — excessive-deficit-procedure (EDP) notification, 22 April 2026: general-government deficit and debt for 2025 (preliminary). See НСИ.
[^vatgap]: European Commission — _VAT Gap Report 2025_: Bulgaria's VAT gap ≈ €781M, 8.6% of the theoretical liability (VTTL). taxation-customs.ec.europa.eu.
[^excise]: Revenue by group (fuel ≈ €1.44B, tobacco ≈ €2.15B, alcohol ≈ €177M, total ≈ €3.8B in 2025): Customs Agency — annual chronicle "Bulgarian Customs in 2025". customs.bg (PDF). Bulgarian rates and floors: PwC — Bulgaria, Other taxes (petrol €363.02/1000L, diesel €330.29/1000L, spirits €562.43/hl, wine — zero rate; cigarettes — minimum total ≈ €113.51/1000); tobacco — Directive 2011/64/EU (minimum €90/1000 cigarettes and ≥60% of the weighted-average retail price; EC — tobacco excise); energy products — Directive 2003/96/EC. The per-country comparator rates behind the "like in…" buttons: Tax Foundation — energy excise in Europe and cigarette excise in Europe (as of 1 January 2026); for alcohol, the EC Taxes in Europe Database (TEDB) — the authoritative per-state €/hl source (Tax Foundation's alcohol tables lag). The 2009–2010 illicit-market episode (share 17.5% → ≈40%) — University of Bath / Center for the Study of Democracy research.
[^gambling]: Gambling Act art. 30 (the two-component fee on gross gaming revenue) and the Corporate Income Tax Act, Part Five (the alternative tax for gaming machines and casinos); the State Gambling Commission was abolished in July 2020 and its functions absorbed by НАП. The variable fee's rise from 20% to 25% effective 1 January 2026 and the ≈ +€32M estimate from the 5 percentage points: economic.bg. Gross gaming revenue ≈ 1.4 млрд лв (≈ €716M) in 2025; budget contribution ≈ 392 млн лв in 2024, over 490 млн лв with the alternative tax; 21 casinos, 1,082 halls, 51 online operators: Focus News. The 2024 changes (land-based betting moved from 15% of turnover to 20% of GGR, equalized with online): НАП/AGIB. The base is industry/НАП-reported, not a standalone КФП line — hence a lower confidence class than the tax lines above.
[^roadcharges]: Road-charge revenue (e-vignettes for cars ≤ 3.5 t + the per-km toll for heavy vehicles), collected by the Road Infrastructure Agency (АПИ) via the National Toll Administration into the republican budget: ≈ 899 млн лв (€459.7M) in 2024 — of which €144M e-vignettes (≈ 281 млн лв) and €302M toll (≈ 590 млн лв) — rising to ≈ 1.1 млрд лв (≈ €562M) in 2025, the figure the lever is anchored on. АПИ publishes the combined annual total each February as a news release (2023 example — "807 млн лв"); the api_road_charges watcher flags a newer one for a manual refresh. The +30% vignette rise (≈ +€53M) in the caretaker "Radev" 2026 budget framework: clubz.bg/176346. 2026 vignette tariffs (annual €49.60, etc., unchanged from 2025): vinetka.org. The base is an administrative АПИ/НТУ figure, not a standalone КФП tax line — a lower confidence class than the tax lines above.
[^imf]: Dirk Muir, Anke Weber, _Fiscal Multipliers in Bulgaria: Low But Still Relevant_, IMF Working Paper 13/49, February 2013. imf.org (PDF).
[^eti]: J. Gruber, E. Saez, _The elasticity of taxable income: evidence and implications_ (2002); E. Saez, J. Slemrod, S. Giertz, _The Elasticity of Taxable Income with Respect to Marginal Tax Rates: A Critical Review_, Journal of Economic Literature (2012). PDF.
[^cit]: R. de Mooij, S. Ederveen, meta-analyses of the corporate base elasticity; J. Heckemeyer, M. Overesch (2017) — consensus semi-elasticity ≈ 0.8. NBER ETI review (PDF).
[^fs]: Fiscal Council of the Republic of Bulgaria — opinion on the draft 2026 State Budget Act / 2026–2028 medium-term plan (12 December 2025): estimate of up to +€50M for raising the dividend tax, with behavioral response. fiscal-council.bg.
[^chetty]: R. Chetty, E. Saez, _Dividend Taxes and Corporate Behavior: Evidence from the 2003 Dividend Tax Cut_, Quarterly Journal of Economics 120(3), 2005 — the canonical study of dividend-payout responses to the tax rate. The dividend→salary relabeling share here is derived conservatively, not a direct estimate from the paper.
[^kso]: КСО art. 6(5), referencing art. 4(1) items 2, 3, 4 and 10: contributions for civil servants, magistrates and court staff, the military and the special-law state employees (МВР, ДАНС, ДАР, НСО, prison service) are paid by the state budget, respectively the judiciary's budget; the health contribution via ЗЗО art. 40(1)(1)(а) and the special statutes (ЗДСл art. 38, defense act art. 220, МВР act art. 183, judiciary act art. 224). Headcounts and average insurable income: НОИ, "Среден осигурителен доход" 2024 — the categories "Държавни служители, следователи, съдии и прокурори; членове на избирателни комисии" (64,178 people at 2,581.64 лв) and "Отбрана и сигурност" (68,684 at 2,438.86 лв; НОИ does not split military from МВР). nssi.bg (PDF).
[^fspers]: Fiscal Council of the Republic of Bulgaria — "Proposals of the Fiscal Council for optimizing personnel costs in the budget sphere" (2026): contributions paid for civil servants including the judiciary, excluding the МВР-act employees, total 385 млн лв; shifting the standard 13.78% employee share onto them yields a fiscal effect of ≈ 200 млн лв (≈ €102M); for police and the military the state covers 73.3% of contributions, hence the "much larger effect" once they are included. fiscal-council.bg; coverage: actualno.com (05.2026). The bill actually tabled (ПП-ДБ, February 2025) is the compensated variant — an employee share phased in over six years and offset by salary indexation (no cut to real income); this matches the simulator's "with compensating salary increase" option, which is fiscally neutral. offnews.bg.
[^matwork]: Return-to-work share if the paid second year is cut — a judgment band (central 45%, range 25–65%) anchored to the НСИ employment gap for mothers of children under 3 (low among EU member states) and the КСО чл.54 rule that lets a mother keep half the benefit while working; OECD Family Database for leave-length context. No Bulgarian point estimate exists, hence the wide band. The representative return wage (≈€1,000/mo gross) is held FIXED — deliberately conservative — so the recapture's uncertainty band derives from the return share alone, not the wage. The recapture mechanism (returning mothers pay PIT + contributions) is in src/lib/bgBehavioral.ts and locked by scripts/budget/__smoke_behavioral.ts.
[^knsb]: КНСБ — its 7 October 2025 package of tax-system changes for the 2026 budget, including raising the corporate tax from 10% to 15%: knsb-bg.org; and its opinion on the draft 2026 State Budget Act (November 2025). The ≈ +€1.1B estimate for a 15% corporate rate is derived from the package.
[^mf2020]: Ministry of Finance — official position on the six reduced-VAT bills, 20 May 2020: −1.5 млрд лв per year for food and medicines (2020 base; all six bills combined −1.8 млрд лв). The VAT base has grown substantially since, so the comparison is scaled. See Mediapool.
[^noi2026]: НОИ — Supervisory Board decision of 9 June 2026: pensions indexed from 1 July 2026 by 7.8% under the Swiss rule, ≈ €513.1M through end-2026. See nssi.bg. The "CPI-only costs roughly half" estimate is derived from the rule's weights (50% CPI + 50% insurable-income growth), not published by НОИ.
[^psub2026]: The sponsors' estimate at adoption of the cut (3 June 2026); the subsidy is €3.00 per valid vote since 30 April 2026. See e.g. eurocom.bg. The model prices a full year; the 8 months of 2026 come to ≈ €2.1M — matching the sponsors' figure.
[^mf]: Ministry of Finance — 2023 consolidation menu to bring the deficit under 3% (excess-profit tax, removal of the reduced VAT rates, excise hikes), as reported by Sega: segabg.com. On restaurant-services VAT (2024–25), the Ministry's position that the reduced 9% rate could stay only if a lightening package raised more than returning to 20%: minfin.bg.
[^coicop]: Eurostat — household final consumption expenditure by purpose (COICOP), series nama_10_co3_p3. ec.europa.eu/eurostat.
[^ses]: Eurostat — Structure of Earnings Survey, series earn_ses_hourly, 2022 wave. ec.europa.eu/eurostat.
[^ecb]: European Central Bank — _Economic Bulletin_ 2/2019, "Interest rate-growth differential and government debt dynamics" (debt-dynamics methodology). ecb.europa.eu.
[^naptiers]: НАП/MoF written answer for tax year 2023 — the distribution of declared income across 7 annual-taxable-base groups (filer count and PIT paid). Ingested as a source in scripts/budget/nap_income_tiers.ts and the validation is locked by the smoke test scripts/budget/__smoke_income_tiers.ts. minfin.bg/bg/wreply/996-4/12881.