Twenty years of Bulgarian cabinets — what the numbers actually show
Published: 2026-05-24
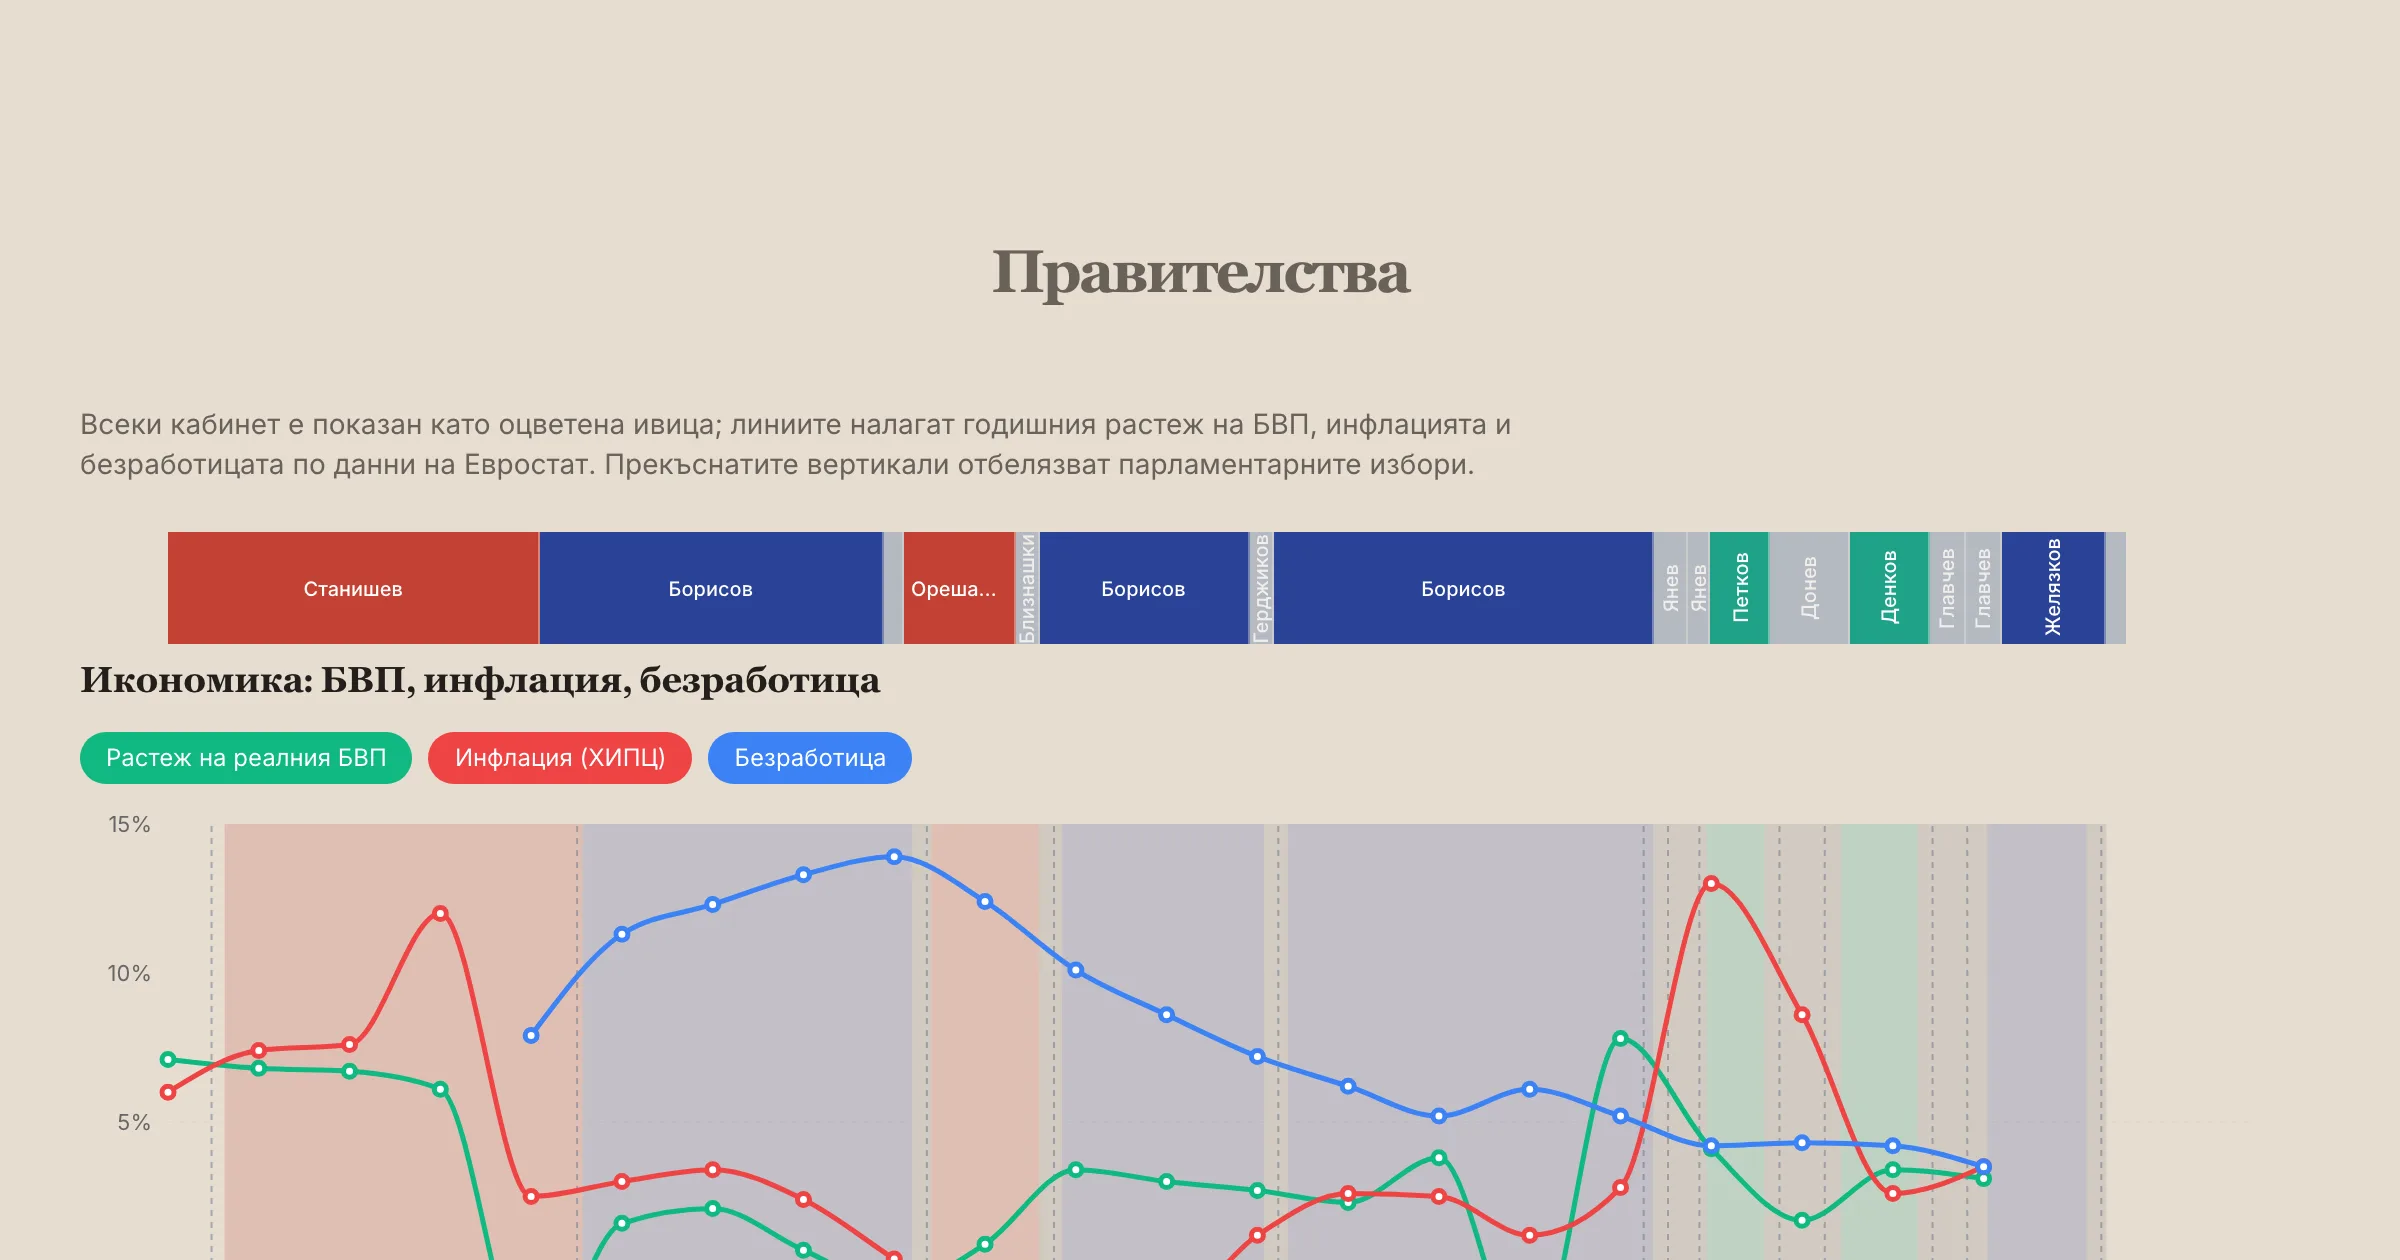
Analysis of all 18 cabinets since 2005 through their macro footprints — GDP, inflation, unemployment, debt and EU funds. What worked and what didn't for each mandate, who left the bill for the next, and why the last 4 years are a paradox: the most unstable politics on top of the strongest economy since EU accession.
Between August 2005 and May 2026 Bulgaria had 18 cabinets: 10 regular and 8 caretaker. The average regular cabinet ran for under two years. Only two — Stanishev and Borisov III — completed the full parliamentary term (3 years 11 months and 4 years, respectively). Over the same period the four headline macro indicators — GDP, inflation, unemployment and government debt — passed through three clearly distinct cycles: catch-up growth and pre-crisis overheating (2005–2008), crisis and stagnation (2009–2014), and best-in-region positioning (2017–2025) — the last achieved against the backdrop of the most politically unstable stretch in post-1990 Bulgarian history.
This article is not a policy evaluation. It is an analysis of the numbers from indicators and governments on electionsbg.com. We walk each cabinet through its macro footprint — what the data shows on its watch, and what lags forward into the next mandate. A larger weight is given to the last ~4.5 years — the Petkov → Donev → Denkov → Glavchev → Zhelyazkov → Gyurov chain, six parliamentary elections (Nov 2021 → Apr 2026) that culminated in the country joining the eurozone.
The big picture in eight numbers
Before going cabinet by cabinet, here are the eight numbers that frame the rest. All values are at the latest available quarter:
| Indicator | Now | Rank (5 peers + EU27) | Source |
|---|---|---|---|
| Real GDP growth | 2.9% (Q1 2026) | strong (4th of 5) | Economy |
| Inflation (HICP) | 2.4% (Q1 2026) | 2nd (below EU27) | Economy |
| Unemployment | 3.2% (Q4 2025) | lowest of 5 | Economy |
| Government debt (% GDP) | 29.9% (Q4 2025) | lowest of 5 | Fiscal |
| Budget balance (% GDP) | −2.2% (Q4 2025) | better than EU27 (−3.2%) | Fiscal |
| Current account (% GDP) | −11.4% | weakest of 5 | Economy |
| Life expectancy | 75.8 yrs (2024) | shortest of 5 | Society |
| AROPE (at-risk-of-poverty) | 29.0% (2025) | highest of 5 | Society |
The picture is a country with a strong macro frame and weak social outcomes. That split is central to the analysis: every cabinet has to be judged _both_ on its fiscal results _and_ on the fact that those results have not translated into lives lived. Bulgaria is second-lowest life expectancy in the EU — after two decades of catch-up growth.
Cycle 1 — catch-up growth (2005–2008)
Sergey Stanishev — BSP·NDSV·DPS · Aug 2005 – Jul 2009
One regular term of 3 years and 11 months — the second longest in the table after Borisov III. Time-weighted averages over Eurostat quarterly data:
- Avg GDP growth: +5.5% — the highest in our data range
- Avg inflation: 8.2% — the highest for any non-summer-caretaker regular cabinet
- Debt Δ: −13.4 pp of GDP — the largest deleveraging in the table
This cabinet starts on a downward debt trend inherited from the Saxe-Coburg-Gotha era reductions (which brought it down from a peak above 65% debt/GDP in 2001–2002). Over the cabinet's window, gross government debt (per Eurostat ESA quarterly data) falls from 26.6% of GDP at end-2005 to 13.2% by mid-2009. The numbers look stunning until you read their second context: most of the fall is accounting — GDP growth in the denominator plus privatisation receipts and surpluses. The real nominal debt reduction is modest. And 8.2% inflation is a symptom of overheating — credit boom, current-account deficit above 25% of GDP (record), capital inflows pouring into real estate.
The lag: the Global Financial Crisis hits at the very end of his term (Sep 2008 → Lehman), but the first effects on GDP come only at end-2008 and fully in 2009 — i.e. under the next cabinet.
Achievement: EU membership (1 January 2007). On the dashboard you see this as the first vertical marker on the governments chart.
Cycle 2 — crisis and stagnation (2009–2014)
Borisov I — GERB · Jul 2009 – Mar 2013
GERB's first cabinet is sworn in on 27 July 2009 — months into a global recession that had already pulled Bulgarian Q2 2009 GDP down −2.8% YoY (per Eurostat), deepening to −6.4% by Q4 2009. The cabinet inherits an overheated economy _and_ absorbs the full weight of the global financial crisis:
- Avg GDP growth: +0.45% — crisis period
- Avg unemployment: 12.0% — the highest for any cabinet in the table (see Economy)
- Debt Δ: +3.0 pp — the start of the post-crisis re-leveraging cycle
Ends after the February 2013 electricity-price protests — four months before the regular election date. You see these protests as a red band through Feb–Mar 2013 in the event lanes below the governments chart.
Oresharski — BSP·DPS · May 2013 – Aug 2014
A 434-day cabinet. The numbers:
- Avg unemployment: 13.3% — the peak in the table
- Avg inflation: −1.3% — deflation (the only cabinet with negative average inflation)
- Debt Δ: +3.6 pp — much of which is bank intervention
Two of the most consequential events of 2013–2014 happen here:
- DANSwithMe — year-long civic mobilisation after Delyan Peevski's appointment as head of DANS (June 2013). A red band across all of 2013–2014 in the event strip.
- The KTB collapse — bank run and licence withdrawal of Corporate Commercial Bank (June–November 2014). The largest banking crisis in Bulgaria since the 1990s.
The KTB lag is significant: the BGN 3.7 bn sovereign debt issuance (approx. 2.0% of GDP on a cash basis, 2014) to cover the shortfall in the Bank Deposit Guarantee Fund continues servicing debt for the next 10 years — visible in the debt issuance table under the Borisov II–III cabinets.
Borisov II — GERB·RB·PF · Nov 2014 – Jan 2017
The deflationary recovery:
- Avg GDP growth: +3.0% — full restoration of growth
- Avg inflation: −1.1% — still deflation (energy prices down)
- Avg unemployment: 9.6% — back to single digits
- Net EU funds: €4.7 bn — large inflow under the first full 2014–2020 programming period
Ends after GERB's loss in the November 2016 presidential vote (Tsacheva vs. Radev).
Cycle 3 — record growth on top of political chaos (2017–2025)
Borisov III — GERB·OP · May 2017 – May 2021
The longest cabinet in the table — 1,469 days (4 years). Also the only regular cabinet in our data range whose tenure covers both the pandemic and the recovery from it in the same window:
- Avg GDP growth: +1.4% — depressed by the 2020 recession (GDP contracted in all four quarters of 2020, deepest at Q4: −6.4% YoY)
- Debt Δ: −3.6 pp — the largest debt reduction by a regular cabinet in the last 15 years
- Net EU funds: €6.8 bn — the highest in the table
Two of Borisov III's defining events fall in the same July 2020 week. On 10 July 2020 Bulgaria joins ERM II (the eurozone "waiting room") at a fixed rate of 1.95583 BGN/EUR and simultaneously enters the Banking Union — the decisive step on the road to the single currency. In the same days the summer and autumn 2020 anti-government protests erupt; the cabinet completes its term on the regular date, but the political shock stalls momentum and ultimately stretches Bulgaria's stay in ERM II to nearly 5.5 years (versus the 2-year minimum). The protests are clearly visible in the trust-in-government comparison with the EU — exactly in 2020 government trust falls from ~28% to ~17%.
The lag: COVID-era fiscal stimulus (anti-crisis aid, the 60/40 wage subsidy, and employment support) cost a total of BGN 2.8 billion in 2020 (2.3% of GDP) and BGN 4.6 billion in 2021 (3.3% of GDP), with the "60/40" scheme alone absorbing over BGN 2.1 billion by its conclusion in mid-2022. These emergency expenditures collapsed the budget balance from a surplus of +2.1% of GDP in 2019 to a −4.0% deficit in 2020 (per Eurostat). They were financed by drawing down the fiscal reserve (from BGN 12.1 billion at end-2019 to around BGN 7.8 billion by end-2021) and issuing a new €2.5 billion Eurobond in autumn 2020.
The 44th National Assembly anchored these measures with two final-adoption votes: the final second reading of the State-of-Emergency Measures Act extension after the autumn 2020 pandemic wave and the final second reading of the 2021 State Social Insurance Budget Act, which formalised the temporary BGN 50 COVID pension supplement as a budget line.
Yanev I + Yanev II — caretaker · May–December 2021
Two short caretaker cabinets dispatched by caretaker-friendly president Radev between three consecutive snap elections. Avg GDP growth under Yanev I: +8.8% — the highest in the table, but this is a post-COVID rebound (base effect), not government policy.
Kiril Petkov — PP·BSP·ITN·DB · Dec 2021 – Aug 2022
A 232-day cabinet — the shortest regular term in the table. Ends with a no-confidence vote after ITN withdraws.
The numbers, however, are significant:
- Avg inflation: +11.2% — the third-highest in the table, only Donev and Glavchev I are higher
- Avg GDP growth: +5.2% — continuation of the post-COVID rebound
- Avg budget balance: −3.0% — the start of the prolonged balance deterioration
The cabinet inherited a new fiscal reality that began in late 2021, when temporary COVID pension supplements were turned into permanent structural spending, and massive, untargeted energy subsidies for business electricity costs were introduced. The transitional Act extending the 2021 State Budget provisions until 31 March 2022, finally adopted at second reading, kept the COVID pension supplement running past the expiry of the temporary measures, before it was permanently folded into the pension base via the 2022 Budget. This marked the end of Bulgaria's long-standing, highly conservative fiscal anchor and locked the country into deficits around 3% of GDP.
A comparison with regional peers reveals fundamental differences in crisis response. While Greece rapidly consolidated its deficit from −7.5% (2021) to −2.5% (2022), and Romania gradually consolidated under an EU Excessive Deficit Procedure, Bulgaria's deficit remained structurally elevated. Meanwhile, Bulgarian inflation peaked at 15.3% in 2022—substantially higher than Greece's 9.3% and Romania's 13.8%—driven by the high energy intensity of the Bulgarian economy, a larger weight of food and energy in the CPI basket, and strong consumer demand fueled by double-digit nominal salary growth.
Among Petkov's key political achievements is the European Commission's approval of Bulgaria's National Recovery and Resilience Plan (RRP) on 7 April 2022 — a package of roughly €6.2 billion. The plan itself, drafted by the cabinet, included an anti-corruption reform (RRP milestones 220 and 222: establishment of a new, operationally functional Commission for Combatting Corruption and new rules on the criminal accountability of the chief prosecutor). Yet before Petkov's mandate ended, the first attempt to appoint a new KPK chair had already been blocked by his own coalition partner ITN. This unfinished, self-imposed reform becomes the principal obstacle to subsequent RRF tranche payments — a lag that materialises under Glavchev and Zhelyazkov, three to four years later.
The lag: these anti-crisis measures and permanent social commitments continued to weigh heavily on the budget under subsequent mandates, and the self-imposed RRP anti-corruption reform will turn out to be the central blocker for EU funds at the end of the period.
Galab Donev — caretaker · Aug 2022 – Jun 2023
10 months as caretaker — unusually long. Bridges two snap elections (October 2022 and April 2023). The numbers:
- Avg inflation: +13.0% — the highest inflation under any cabinet in the table
- Avg budget balance: −3.0% — continuation of the deficit
This is the inflation cycle peak — driven by _global_ energy crisis, not Bulgarian policy. But Donev is also the cabinet under which the responses to that crisis (aid, compensation measures) formalise the new fiscal norm: 3%-of-GDP deficit becomes the baseline.
Denkov — GERB-SDS·PP-DB · Jun 2023 – Apr 2024
308 days — the first and only rotation cabinet in the table. Ends with **rotation_failed** — the only such termination in our data. The numbers:
- Avg GDP growth: +1.8% — normalisation after the post-COVID bounce
- Avg inflation: +5.4% — dramatic drop from 13% under Donev
- Avg unemployment: 4.4% — back near pre-COVID levels
Under Denkov the serious eurozone-accession negotiations begin, alongside RRF (Recovery and Resilience Facility) reforms. The lag from these efforts shows up only under Zhelyazkov 18 months later.
Glavchev I + II — caretaker · Apr 2024 – Jan 2025
282 days combined. Bridge two more snap elections (June and October 2024). Glavchev I has the worst balance in the table:
- Avg budget balance under Glavchev I: −4.8% — the worst mandate average
This is a signal of fiscal indiscipline in caretaker cabinets without legislative sanction — they run on extended budgets without update. In November 2025, the EU paid out the second RRF tranche after nearly two years of delays, but withheld €214.5 million (of €653 million requested) over the failure to deliver reforms that the Petkov cabinet itself had written into the RRP in 2022 — milestone 220 (a new, operationally functional KPK anti-corruption body) and part of milestone 222 (criminal accountability of the chief prosecutor). The same logic repeats at the end of 2025 on the third payment: of €1.6 billion requested, the EC approved €1.47 billion, freezing a further €150 million-plus for the same two reasons. The long-term effect of this string of partial freezes and overall delay shows under Zhelyazkov as a sharp drop in net EU funds relative to the €6.8 bn record under Borisov III (per preliminary 2025 figures not yet reflected in the dashboard's annual series).
Zhelyazkov — GERB-SDS·BSP-OL·ITN · Jan 2025 – Feb 2026
399 days. The eurozone cabinet — the euro is introduced on his watch (1 January 2026). You see this as the last vertical marker on the governments chart. The numbers:
- Avg GDP growth: +3.1% — healthy growth
- Avg inflation: +3.3% — close to the 2% target
- Avg unemployment: 3.5% — the lowest in the table for any cabinet
- Debt Δ: +6.2 pp — the largest debt build-up by any regular cabinet
The Zhelyazkov paradox is concentrated in two numbers: lowest unemployment in history (3.5%) and fastest debt accumulation by a regular cabinet (+6.2 pp). Debt was primarily financed through massive issuance on international markets (a total of €7.2 billion in Eurobonds in 2025, plus an additional €1.7 billion in domestic bonds—see the debt issuance table). Out of this massive debt haul, barely €234 million went to refinance maturing international bonds, while over 85% was spent directly on covering the new annual cash deficit (which hit €6.09 billion for 2025) and on building up the liquid assets of the fiscal reserve ahead of the eurozone entry. The budget balance on an accrual basis reached −3.6%, which exceeds the 3% Maastricht threshold the country had only just cleared to join the eurozone.
Ends after the autumn 2025 protests — you see them as a new red band in the event strip.
Gyurov — caretaker · Feb – May 2026
A short caretaker whose primary duty is delivering the 19 April 2026 election. Too short for quarterly averages.
The defining legislative act of this brief mandate is the draft new Anti-Corruption Act, submitted on 30 April 2026 — an attempt to unblock the frozen RRF funds before the EC deadline of 31 May 2026 expires. The draft establishes a five-member KPK, jointly elected by parliament, the president, the Supreme Cassation Court, the Supreme Administrative Court and the Supreme Bar Council, with a chair rotating annually by lot. The newly elected National Assembly (sworn in after the 19 April 2026 vote) passes the law on first reading on 22 May 2026, shortening the gap between readings to four days to meet the EC deadline. The second-reading vote is still pending.
Radev — incumbent since May 2026
Only 17 days at the time of writing. No relevant averages yet.
Five clear policy-lag examples
One of the most important principles when analysing governments: causes and effects often live in different mandates.
- The Global Financial Crisis (2008) is a global shock, but for Bulgaria it hits at the end of Stanishev's term and shows up primarily as 12% unemployment under Borisov I. You see this as a deep green GDP dip in Economy exactly at the 2009 transition.
- The KTB stabilisation issuance (2014) is a financial decision under Oresharski — but servicing that debt is visible in the issuance table for the next 10 years, under cabinets Borisov II, III, Petkov and Denkov.
- Social spending and automatic indexation (2020–2023): temporary BGN 50 COVID pension supplements introduced under Borisov III in 2020 (anchored in parliament through the final second reading of the 2021 State Social Insurance Budget Act) were extended in late 2021 under Petkov (via the final second reading of the January 2022 budget-extension Act) and subsequently folded into the pension base through the 2022 Budget. The subsequent tie of the minimum wage to 50% of the average gross salary (finally adopted via the Labour Code Amendment Act on 1 February 2023, on a "BSP for Bulgaria" proposal) triggered an automatic wage-wage spiral. This social-budgetary lag stripped subsequent budgets of flexibility, caused three consecutive years of deficits around 3.5%, and forced a record debt accumulation of +6.2 pp under Zhelyazkov in 2025 to cover the cash shortfalls of the social security system and the state.
- The path to the eurozone begins under Borisov III with Bulgaria's ERM II entry on 10 July 2020 — within days of the summer protests erupting, which stalled political momentum and ultimately stretched the ERM II stay to nearly 5.5 years (versus the 2-year minimum). Legislative and technical preparation was largely completed under Denkov (texts, translations, ESMA notification), but the mandate that gets to mint "we adopt the euro" is Zhelyazkov's. The same dynamic runs in reverse for EU funds: the anti-corruption reforms (RRP milestones 220 and 222) were written into the plan by the Petkov cabinet itself in 2022, but went undelivered for the next four years and triggered partial freezes on both the second tranche (November 2025, −€214.5 million) and the third (December 2025, −more than €150 million). This explains the visible compression of net EU funds under Zhelyazkov relative to the €6.8 bn record under Borisov III. The new KPK draft law was finally submitted by the Gyurov caretaker on 30 April 2026 and passed on first reading on 22 May 2026 — already under the newly elected parliament.
- The inflation drop from 13% (Donev) to 3.3% (Zhelyazkov) is a result of the global energy-price decline none of the four intervening cabinets had any control over.
The last ~5 years — deformation across 6 indicators
Focus on 5 cabinets: Petkov → Donev → Denkov → Glavchev I+II → Zhelyazkov. This is roughly 1,500 days — nearly 4.5 years if we include the November 2021 vote that produced the Petkov cabinet — in which the country had more snap elections (6) than regular mandates (3).
| Cabinet | Period | Avg GDP | Avg Infl | Avg Unemp | Avg Bal | Debt Δ |
|---|---|---|---|---|---|---|
| Petkov | 12.2021 – 8.2022 | +5.2% | +11.2% | 4.7% | −3.0% | −0.7 pp |
| Donev (CT) | 8.2022 – 6.2023 | +2.5% | +13.0% | 4.1% | −3.0% | −1.5 pp |
| Denkov | 6.2023 – 4.2024 | +1.8% | +5.4% | 4.4% | −2.3% | +1.4 pp |
| Glavchev I (CT) | 4.2024 – 8.2024 | +3.3% | +2.5% | 4.0% | −4.8% | +2.3 pp |
| Glavchev II (CT) | 8.2024 – 1.2025 | — | — | — | — | — |
| Zhelyazkov | 1.2025 – 2.2026 | +3.1% | +3.3% | 3.5% | −3.6% | +6.2 pp |
What reads out of this table:
- The inflation cycle is symmetric: from 11.2% (Petkov) to 13.0% (Donev) to 5.4% (Denkov) to 2.5% (Glavchev I). Global cycle, not domestic policy.
- Unemployment fell continuously from 4.7% → 3.5% — impressive, but see the note below.
- The budget balance worsens continuously: from −3.0% (Petkov) to −4.8% (Glavchev I peak) to −3.6% under Zhelyazkov. This is a new fiscal norm in the third consecutive year ≈ −3.5% deficit. This structural deficit is a direct consequence of automatic spending laws: the legal tie of the minimum wage to 50% of the average gross salary (initiated by "BSP for Bulgaria" in the 48th National Assembly; see the roll-call final second reading of the Labour Code Amendment Act on 1 February 2023, effective 2024, triggering an automatic wage-wage spiral across the public sector payroll) and the strict application of the Swiss Rule for pensions (see the roll-call 21 May 2024 NA Resolution mandating the 11% pension uprating under Art. 100 SIC, which, in a high-inflation and high-wage growth environment, automatically raised pension expenditures by over 11% annually, tearing a massive structural hole in the social security budget covered by direct transfers from the state treasury).
- Debt accumulation accelerated dramatically: 6.2 pp of GDP in the Zhelyazkov term alone (larger than any other single-cabinet accumulation in the table). This new debt was raised almost entirely to cover the cash deficits and buffer the fiscal reserve for the eurozone entry, rather than to refinance older debt (which faced negligible maturities in 2025).
- Unemployment is phenomenally low (3.5%), but combined with AROPE 29% it means many employed people live in poverty risk — the "working poor" phenomenon.
The lag that has not yet arrived: the 2024–2025 fiscal loosening has to be consolidated to meet the extended Maastricht rules the country has just agreed to. That burden will fall on the incumbent regular Radev cabinet or whichever government succeeds it — who will have to clean up someone else's bill.
What works and what doesn't — summary
Works
| Indicator | Achievement | Source |
|---|---|---|
| Government debt | 29.9% of GDP — lowest among 5 regional peers + EU27 | Fiscal |
| Unemployment | 3.2% — lowest among peers; falling continuously from 13.3% (2014) | Economy |
| WGI Government Effectiveness | +0.043 (2024) — +0.20 since 2007; the only WGI dimension improving | Compare with EU |
| EU funds | €6.8 bn net under Borisov III (record) | Fiscal |
| GDP growth | 2.9% while EU stagnates (1.0%) | Economy |
Doesn't work
| Indicator | Problem | Source |
|---|---|---|
| AROPE (at-risk-of-poverty) | 29% — highest among 5 peers; not falling despite growth | Society |
| Gini coefficient | 37.7 — highest among 5 peers | Society |
| Life expectancy | 75.8 yrs — shortest among 5 peers; despite high health spending | Compare with EU |
| WGI Control of Corruption | −0.24 (2024) — still below the 2007 level (−0.06) | Governance |
| Political Stability (WGI) | drop from +0.42 (2020) to +0.04 (2024) — −0.38 in 4 years | Governance |
| Fiscal consolidation | 3 consecutive years of deficit above 3% — new uneven normalisation | Fiscal |
| Debt accumulation | +6.2 pp under one cabinet (Zhelyazkov); +9.0 pp over 4 years | Fiscal |
To the next mandate
A short summary of the inheritance any new cabinet sworn in from autumn 2026 receives:
- Eurozone: already inside. Maastricht criteria must be maintained — but the deficit is 3.6%, above the threshold.
- RRF: payments have been partially frozen and delayed since 2024. Second tranche: €438.6 million paid in November 2025, €214.5 million withheld; third tranche: €1.47 billion paid in late 2025, a further €150 million-plus withheld — all for the same reason (unfulfilled milestones 220 and 222 on anti-corruption, written into the plan by the Petkov cabinet itself in 2022). On 22 May 2026 the newly elected National Assembly passed the new Anti-Corruption Act on first reading; the second reading is due within the EC's 31 May 2026 deadline, which puts the incoming government in a position to be the first to report delivery to the EC and unblock the frozen funds before the six-month window from the third payment runs out.
- Debt: a 6.2-pp build-up under one mandate — a record. Without consolidation we face the EU's Excessive Deficit Procedure (EDP).
- WGI: control of corruption still below the 2007 level. This is the area with the largest deficit vs. the EU.
- Social cohesion: highest AROPE among peers. Without redistributive policy, economic growth produces no social return.
As a closing line: Bulgaria is a stable economy on top of an unstable government. Six snap elections and eight different cabinets over the past ~5 years, yet the macroeconomy works at its best levels since EU accession. Time will tell whether this resilience is a credit to the administration (which has improved WGI Government Effectiveness continuously since 2007), to the long-running discipline imposed by the currency board and strict Maastricht-criteria compliance ahead of eurozone entry, to the abundance of EU funds (see the fiscal pages), or to inertia. One important caveat: a meaningful share of the record-low unemployment is the denominator effect of emigration — the working-age population has shrunk by roughly 15% since 2007.
You can track the data in real time through indicators and explore each individual cabinet through the governments page.
_Sources: Eurostat (gov_10a_main, gov_10q_ggdebt, namq_10_gdp, prc_hicp_minr, une_rt_q), World Bank WGI (source 3), Ministry of Finance (CFB), Court of Audit, parliament.bg. The analysis is based on time-weighted averages of quarterly series within each cabinet's window (see cabinetMetricsFor for the methodology). Data updates automatically; values in this text are valid as of 24 May 2026. Compatibility note: Inflation indicators utilize the Harmonised Index of Consumer Prices (HICP) for EU comparability, and the budget balance is computed under ESA 2010 accrual standards (which may vary slightly from the cash-based reports of the Ministry of Finance)._