Bulgaria in data
What is happening in Bulgaria, measured from open data: inflation, unemployment, GDP growth and government debt from Eurostat, shop prices, the state budget and its execution, public procurement, EU funds, every election since 2005, and a profile of each municipality.
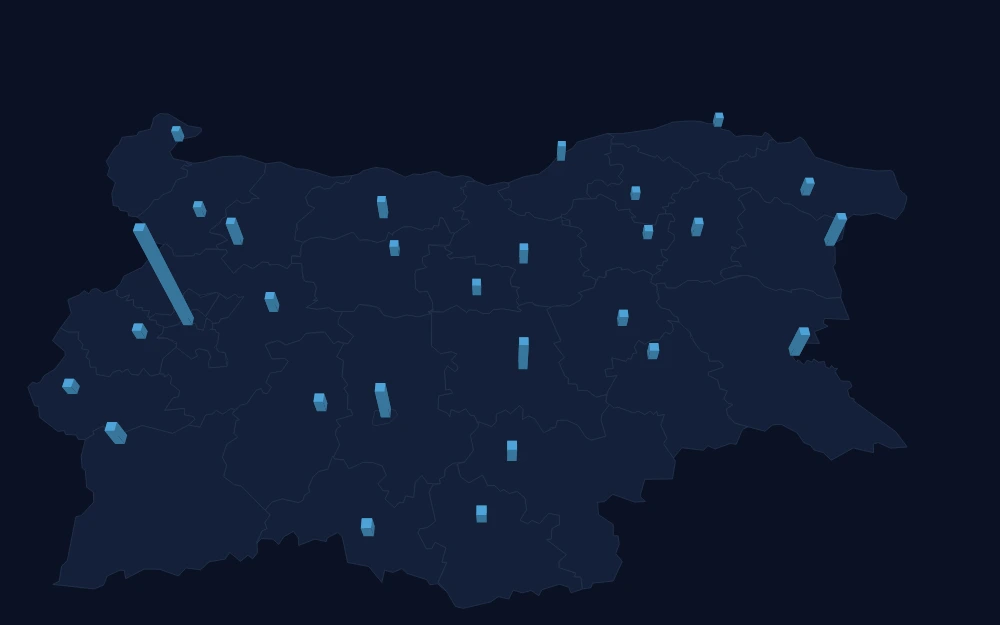 The map above rotates: columns by province for public procurement (at the buyer's seat), for EU funds and for farm subsidies; arcs from buyer to contractor; and a five-stop tour. The three layers are three separate measures, never a sum.
Main sections
- Prices and consumption
- My municipality
- Elections
- Government sectors
- State budget
- Public procurement
- EU funds
- Governance
How to read the numbers
Every figure carries its period and its basis. The four headline numbers come from four different Eurostat datasets at different frequencies and are not comparable with each other: growth and inflation are change on a year earlier, unemployment is a level, and debt is a share of GDP. The procurement, budget and EU-funds totals come from separate, overlapping corpora and are never summed.