The money map: where the state buys and where the money goes
Published: 2026-09-07
An interactive flight over public procurement, EU funds, farm subsidies, prices and elections. It shows not only the geography of €94 billion in contracts, but exactly how much can honestly be placed on the map.
Where the state buys
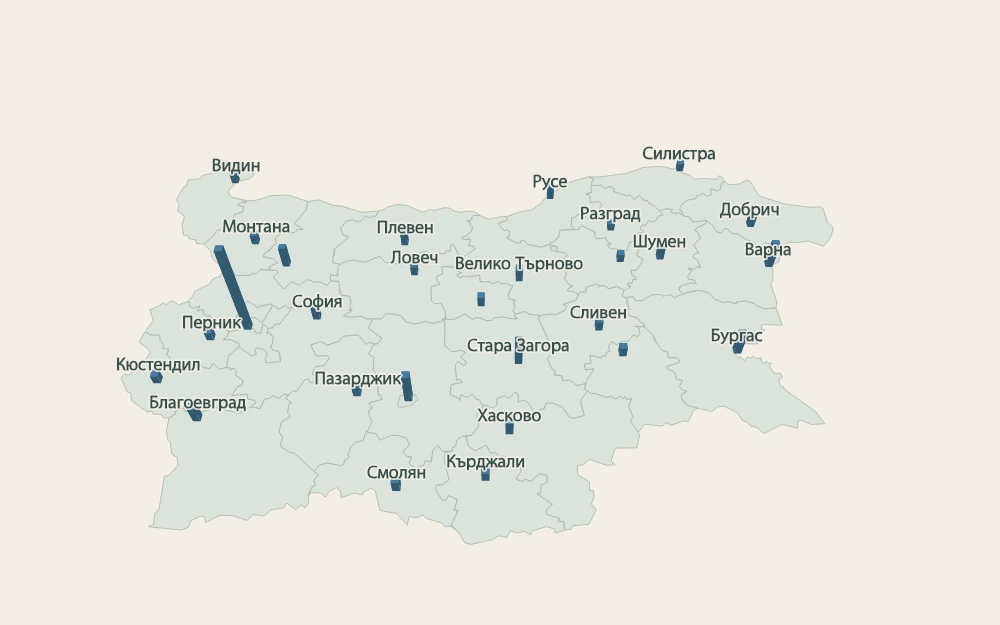
The artifact counts 407,512 contract rows. The procurement tile values them at €94.0 billion after excluding 628 rows with an empty contractor identifier. The capital accounts for 56.6% of the value by the buyer's registered seat. That does not mean the same share of the work happened in Sofia: ministries, the Road Infrastructure Agency, the railway infrastructure company and Bulgartransgaz are seated there while commissioning projects nationwide.
The columns show who buys, not where a contract is performed. They use only the buyer's seat and do not distribute a national contract among its sites.
Open the full public-procurement register.
Where the money goes
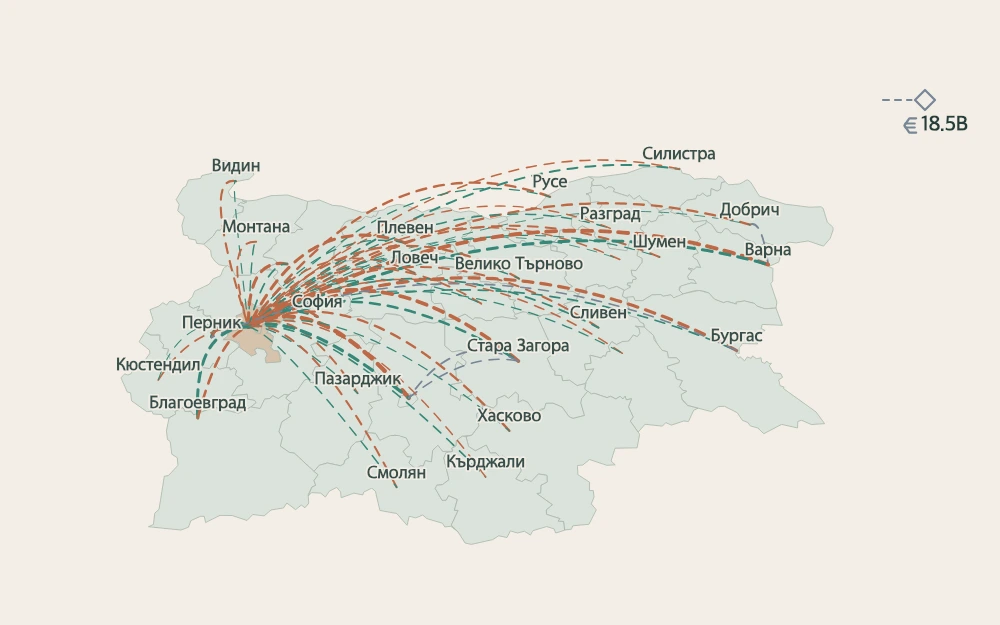
Among contracts for which both ends can be placed, 56.5% of the value stays within the same region, 23.9% flows into Sofia, and 11.8% flows out of Sofia. Those shares describe only the placed part, not all procurement.
The full basis is €43.9 billion out of €94.2 billion, or 46.6% of contracted money, with both ends on the map. This denominator includes every row tagged as a contract; the 628 rows omitted from the procurement tile account for €0.21 billion, so the two totals differ by 0.22%. For consortia, €9.8 billion is attributed to the largest member with a resolved region; this affects 2,031 groups, 540 of which have members in more than one region.
| Unplaced part | Value |
|---|---|
| Commerce Registry company without a resolved seat | €30.7bn |
| Outside the Commerce Registry / foreign | €18.5bn |
| Unplaced consortium carriers | €0.8bn |
| Synthetic or non-EIK identifiers | €0.1bn |
| Buyer without a placed seat | €0.3bn |
The point outside the map is not assigned an invented region: it keeps the value with unknown geography visible.
Inspect the contracts, buyers and contractors.
EU funds versus procurement
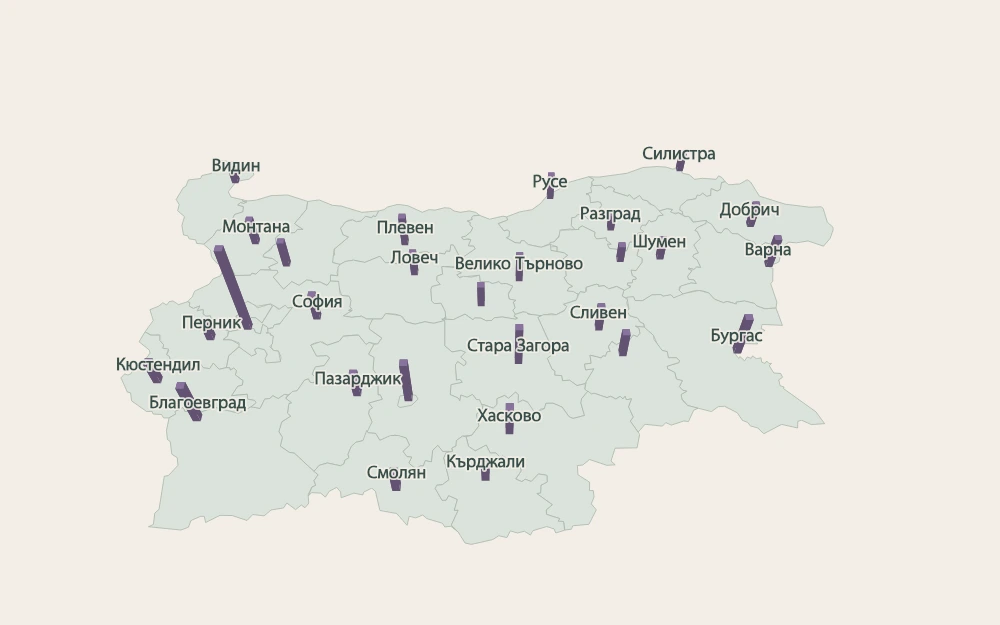
For EU-funded projects the map can place €16.1 billion out of €33.7 billion, or 47.8%. Much of the missing part is not a geocoding error: nationwide programmes do not have one region to which they can honestly be assigned.
EU funds and procurement are different views over partly overlapping processes. An EU-funded contract can occur in both corpora, so their totals must not be added together.
Explore EU-funded projects and beneficiaries.
The countryside turns the map around
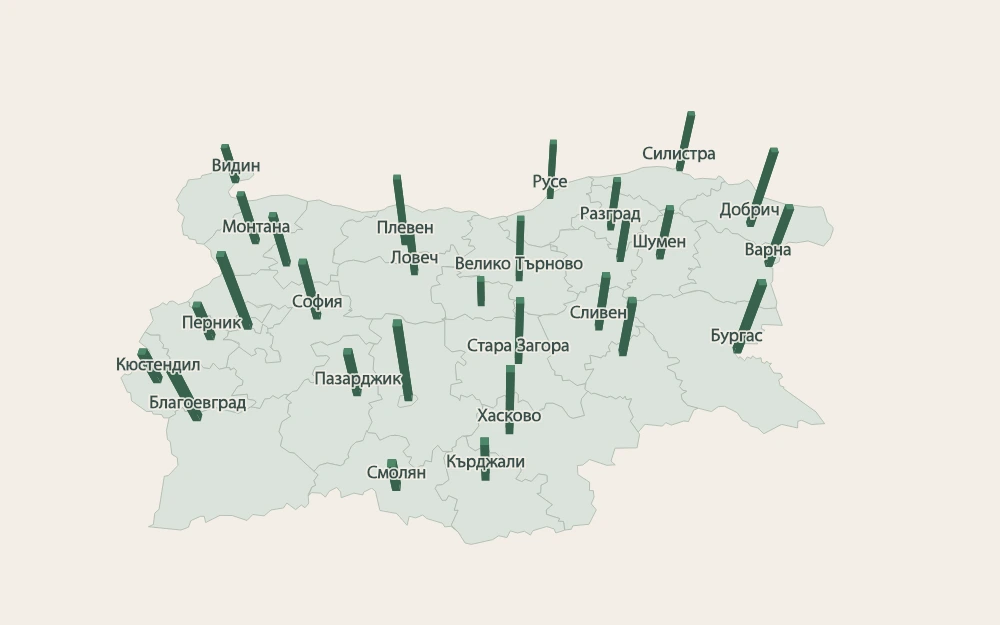
Farm subsidies shift the centre of gravity. Out of €11.0 billion, Plovdiv has the largest total at €819 million, followed by Sofia at €717 million and Dobrich at €698 million. Sofia is high partly because the paying administration is there; this should not be read as a map of cultivated land.
That is why each layer has its own scale. A scale shared with procurement would reduce the agricultural columns to almost invisible marks.
Open the farm-subsidy register.
Prices after the euro
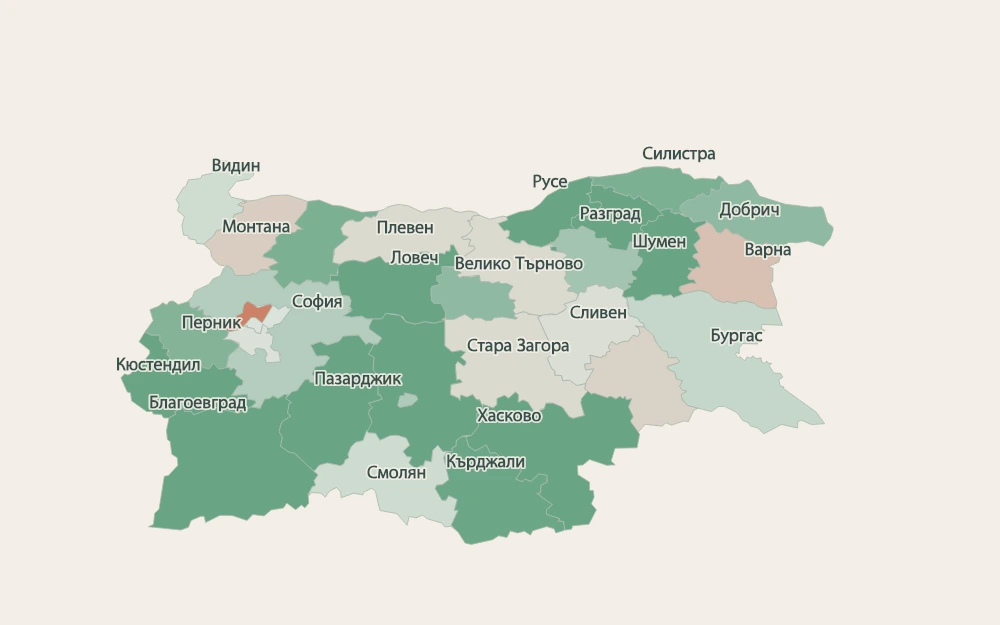
On 6 September 2026, the national monitored-basket index stands at 97.8, against a baseline of 100 on 2 January. The map shows 31 districts calculated from a fixed panel of 217 settlements, preventing coverage changes from masquerading as price changes.
This is a monitoring index based on prices published by the Consumer Protection Commission, not official CPI or HICP. The colour compares each district with the same baseline; it does not imply that every household buys the same basket.
See the products, places and price-monitoring method.
Elections on the same map
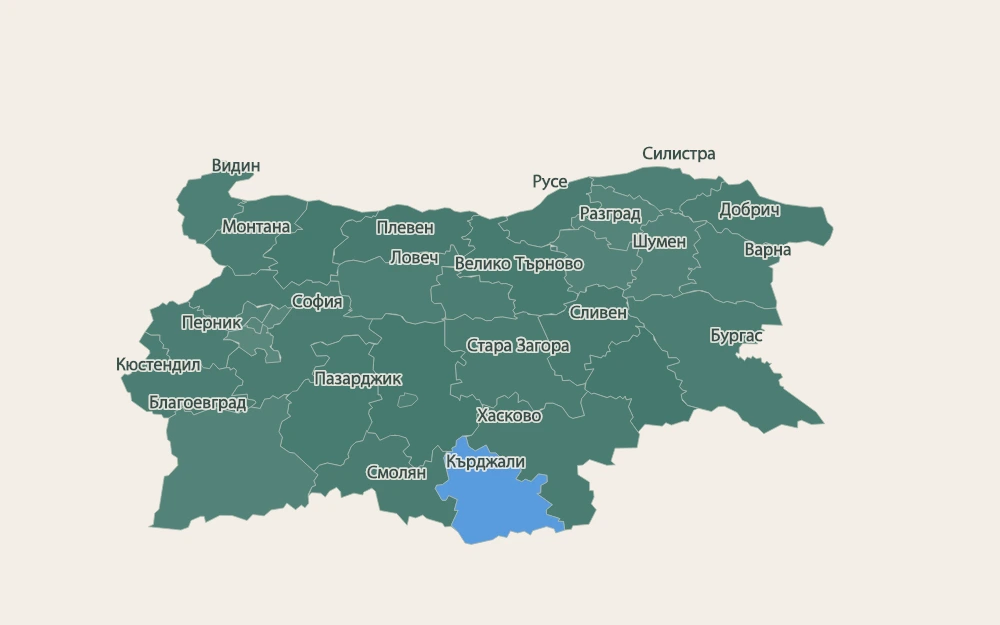
The same 31 polygons can carry another kind of result. In October 2024 the winners were split among GERB–SDS (24 districts), DPS–NN (3), PP–DB (2) and APS (2). In April 2026 the winner changes in every district: “PrB” leads in 30, and DPS in one.
The transition shows the winner and their share in each multi-member district; it is not a model of individual votes moving between parties. This is the only chapter kept out of the moving map on the home page: there, motion remains about money, while the election result appears in its own context here.
Explore elections, districts and the full results.
All monetary values come from the artifact whose latest contract date is 4 September 2026. The map publishes its measured coverage and keeps the unknown visible instead of allocating it by assumption.