A budget scorecard for Bulgaria — five risks, five opportunities
Published: 2026-05-19
A structured read of Bulgaria's state budget, pinned to specific tiles on the /budget dashboard. Analysis of the new proposal to raise the maximum insurable income to €2,300, plan-versus-actual ministry deviations, the social-functions concentration of spending, and the post-euro fiscal headroom.
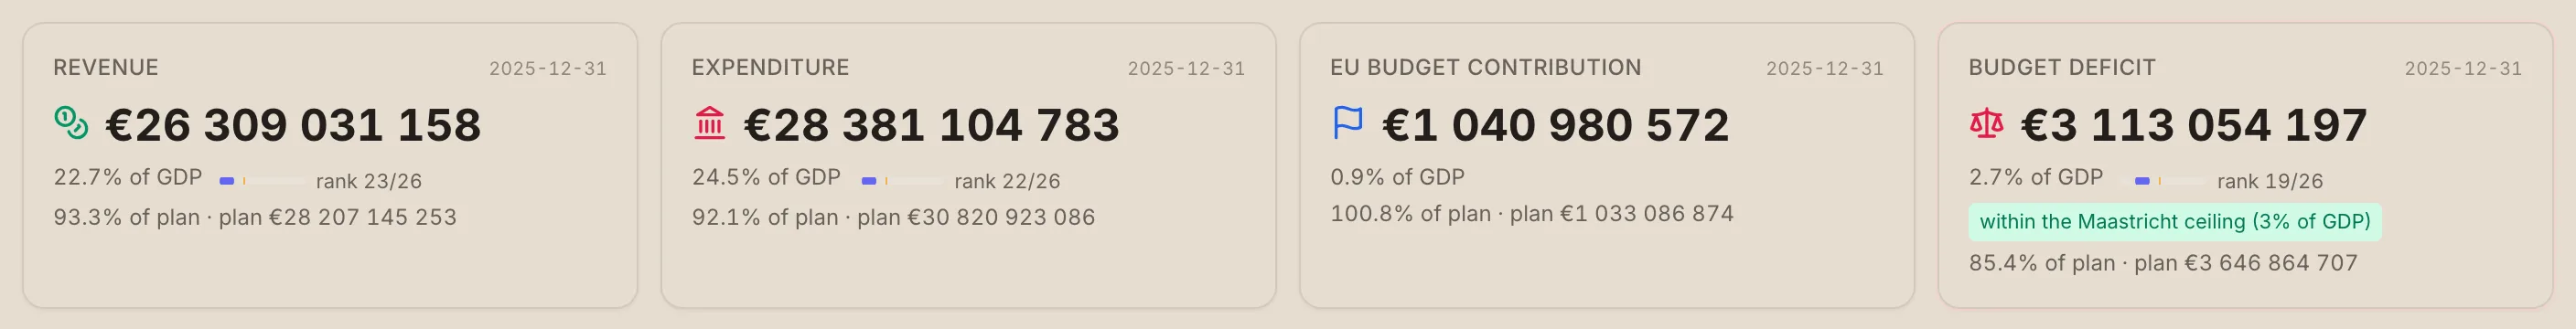
Bulgaria runs one of the smaller state budgets in the EU as a share of its economy — general-government expenditure is 41.7% of GDP against the EU-27 average of 49.5%. Public debt sits at 29.9% of GDP, well under the 60% Maastricht ceiling, and the 2025 cash deficit stayed within the 3% Maastricht limit. At the same time, every closed fiscal year shows material gaps between the original State Budget Law (ЗДБРБ) and actual execution — for 2024, the Ministry of Environment ended up at +214.4% over plan, the Ministry of Defence at +68.0%, while the Ministry of Labour and Social Policy fell -29.9% short of plan.
This piece is a structured scorecard of the state budget — five risks and five opportunities, each pinned to specific modules of the /budget dashboard and the data behind it. The current focus is the new 2026 budget proposal, which lifts the maximum insurable income (МОД) from the current €2,111.64 to €2,300 per month. This is the government's second attempt — the original proposal to take the ceiling to €2,352 met substantial public pushback.[^mod-sources]
How to read the scorecard
Every item carries three elements: a finding (the concrete budget data point), a severity/impact rating (high / medium / low), and the dashboard module where the live value lives. All figures here are valid as of 18–19 May 2026. The dashboard stays current; open it any time for the latest values.
Sources are entirely public and integrated into a single base: the Finance Ministry's monthly fiscal bulletin (КФП), Държавен вестник (the State Budget Law and amendments), the per-ministry program-budget execution reports, Eurostat's functional classification dataset (gov_10a_exp), the fiscal-aggregate-as-%-of-GDP dataset (gov_10a_main), and the Court of Audit register. Each series updates on its own cadence — КФП monthly, ministry execution reports yearly in the spring after a fiscal year closes, and Eurostat with the usual 12–18 month lag.
Risks
R1 · МОД raise — structural growth of the social-security burden — HIGH
The 2026 budget proposal raises the maximum insurable income (МОД) from €2,111.64 to €2,300 per month (+€188.36, or 8.9%). The forecast extends to €2,505 in 2027 and €2,659 in 2028. The original €2,352 proposal was withdrawn after public protests.[^mod-sources]
[^mod-sources]: Timeline: GERB's first 2026 budget, voted on second reading in the parliamentary Budget Committee on 26 November 2025, raised МОД from BGN 4,130 to BGN 4,600 (€2,352); the vote went through during a citizen protest in front of Parliament — see Boulevard Bulgaria, 26.11.2025. That budget was subsequently rejected. The new proposal (May 2026) drops the step to €2,300 — see Sega.bg, 18.05.2026 and Forbes Bulgaria, 18.05.2026.
The maximum insurable income sets the ceiling against which employee and employer social-security contributions accrue. From 2018 to today, МОД rose from €1,329 to €2,112 — close to a doubling in nominal terms. The new proposal continues the trend at a forecast pace of roughly €189 per year through 2028.
Economic impact. For an employee on €2,300/mo gross instead of the current €2,112, employee SSC (13.78%) goes up by €25.93/mo, and employer SSC (around 19.8%) by another €37.26/mo. The total social-security burden rises by close to €63 per month per affected worker. The Finance Ministry estimates roughly 100,000 affected employees — implying additional annual budget revenue in the range of €75–90M.
Distributional effect. The real burden falls on middle-to-upper income earners — those already above the current cap. For them the effective marginal rate jumps from 10% (PIT only) to about 23% (PIT + full SSC) over the new bracket. Above €2,300 the marginal rate drops back to 10% — the signature pattern of a flat-tax regime with a contribution ceiling.
Tie to the deficit. The 2025 cash deficit closed at €6.09B, and Q1 2026 alone has already accumulated €1.92B. The additional €75–90M from raising МОД covers only 1.2–1.5% of the annual deficit — not nearly enough as a stand-alone fiscal lever. The real driver of the change is the rising pension obligation (a planned 7.8% indexation from 1 July 2026 under the Swiss-rule formula), not budget balancing.
Where to look: The tax-bill calculator in the "Composition" section accepts custom МОД values (try €2,300 for the new proposal or €2,352 for the withdrawn one) and shows the live effect on your personal tax + SSC bill. Real-time scenario testing is the foundation of objective citizen analysis.
R2 · Material gaps between the State Budget Law and actual execution — MEDIUM-HIGH
For fiscal 2024: Ministry of Environment and Water — +214.4% over plan (€104M → €328M). Ministry of Defence — +68.0% (€1.09B → €1.83B). Ministry of Labour and Social Policy — -29.9% under plan (€1.46B → €1.03B).
The original State Budget Law defines the ministry-level spending limits approved by Parliament. Actual execution is published at year-end in each first-level spending unit's "Program budget execution report". The gap between these two figures tells you how strictly the executive sticks to the parliamentary limits.
The 2024 gaps at the largest ministries are systematic and large. Environment ran at more than triple the original plan — mostly because of accelerated EU cohesion-fund disbursement that wasn't reflected in the original law. Defence spent €740M extra — partly procurement and Ukraine-support outlays, again without a matching ЗДБРБ amendment. In the other direction, the Ministry of Labour and Social Policy spent €440M less than planned — under-execution that likely reflects delayed transfers to the pension system.
Institutional effect. When actual execution diverges systematically from the parliamentary limit, the budget vote loses some of its meaning as a public-oversight tool. This isn't a corruption signal — most of the gaps reflect ad-hoc amendments adopted during the year or automatic accounting of EU transfers that weren't predictable when the ЗДБРБ was voted.
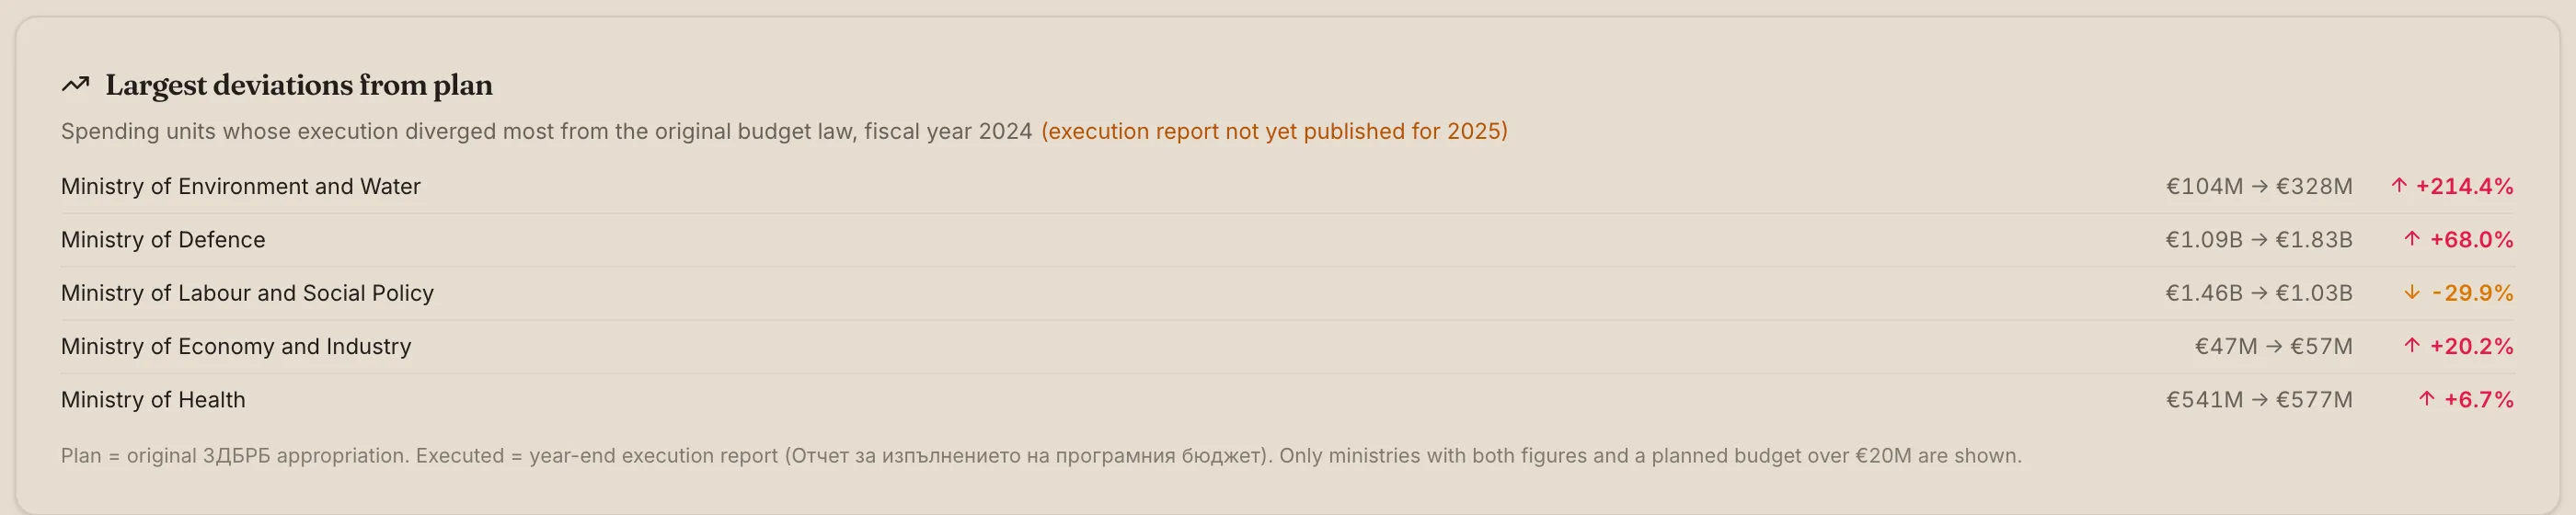
Where to look: The Largest deviations from plan tile and the full Spending units table below it in the Composition section. Both refresh annually in the spring once ministries publish their reports.
R3 · Concentration of spending in social functions — HIGH
By COFOG (Eurostat, 2024): social protection 36.8% of total spending (€7.7B), health 13.7% (€2.9B), education 10.9% (€2.3B). General public services at only 7.5% — among the lowest shares in the EU.
The structure of Bulgarian government spending is heavily tilted toward social transfers. Social protection (mostly pensions) absorbs over one third of the public purse. Combined with health, the two functions consume more than 50% of all general-government spending.
Against the EU-27, Bulgaria ranks near the bottom for general public services (rank 25/26, 2.9% of GDP against the EU-27 average of 6.1%) — a sign of a thin administrative backbone. At the same time, on public order and safety Bulgaria sits in 2nd place in the EU (rank 2/26, 2.8% of GDP against the 1.7% average). That reflects a historical budgetary preference — police and security forces are prioritised over the civil service.
Demographic pressure. The social-protection concentration will grow automatically — population ageing and the pension indexation formula (7.8% rise from 1 July 2026) push spending up structurally. Without a matching revenue lift (see R1), the deficit widens and the remaining functions (education, capital, defence) compete for a shrinking pool.
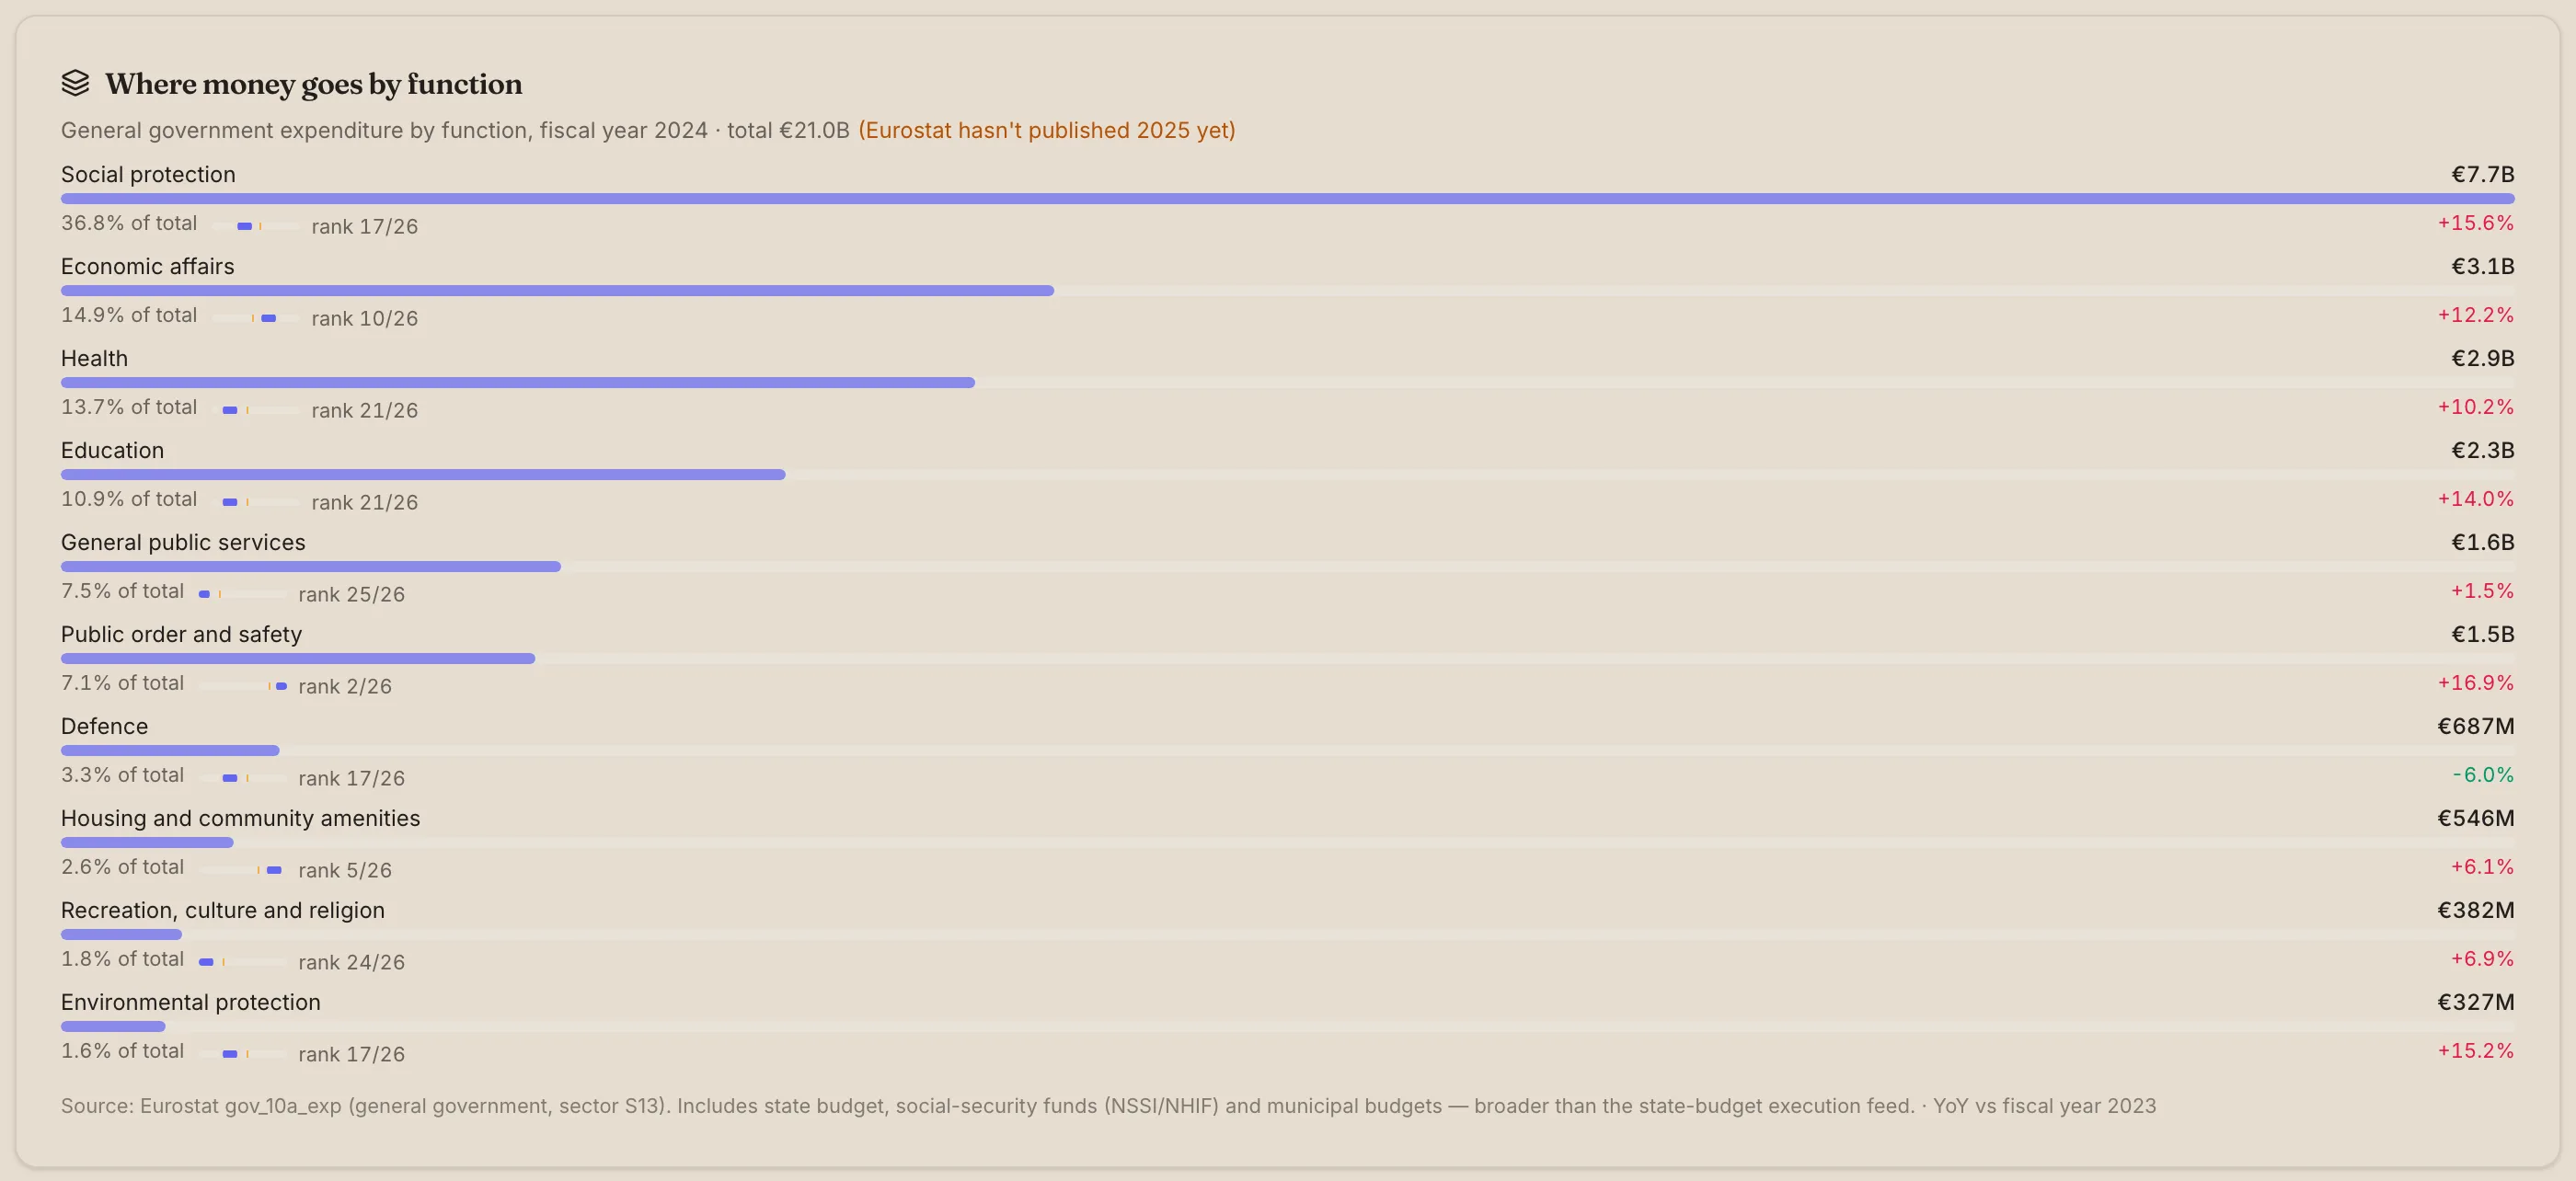
Where to look: The Where money goes by function tile shows the full COFOG breakdown with peer-band chips for every function (BG rank + EU-27 average).
R4 · Under-investment in education and environment — MEDIUM
Education: 4.1% of GDP (rank 25/26 in the EU). Environmental protection: 0.6% (rank 17/26). For comparison, the EU-27 average is 4.7% for education and 0.8% for environment.
Bulgaria systematically under-spends on education compared with its European peers. This has a direct effect on long-run labour productivity, demographic outcomes (skilled emigration) and the economy's innovation capacity. Since 2020 the education share of GDP has crept up from 3.5% to 4.1%, but convergence to the EU average is slow.
On environment, the direction looks reversed — fiscal 2024 actuals ran 214% over plan at the Ministry of Environment (see R2), signalling accelerated EU-fund absorption. Positive in the short term, but the financed projects depend on external EU money, not on sustainable domestic spending.
Strategic effect. These two sectors are the foundation of long-term convergence with Western Europe. Under-investment locks the country into a perpetual catch-up mode.
Where to look: The Where money goes by function tile — Bulgaria's position on each function is rendered as a small horizontal bar with a text rank within the EU-27.
R5 · Cash deficit accumulating ahead of plan — LOW-MEDIUM
Q1 2026: cash deficit €1.92B on cumulative revenue €5.46B against expenditure €7.38B. Against the full-year plan (€3.65B deficit), Q1 already accounts for about 53% of the planned annual deficit.
Cash execution is seasonally volatile — corporate-tax inflows arrive mostly in Q2/Q3, and EU transfers are uneven. So the €1.92B Q1 deficit isn't an automatic crisis signal. But it warrants close watching: full-year 2025 cash deficit hit €6.09B, materially overshooting the original plan of €4.1B.
Maastricht context. The 2025 deficit landed at 2.7% of GDP — still inside the 3% ceiling, but with a smaller buffer than the historical norm. For 2026 the original plan budgets a 2.9% of GDP deficit — right against the Maastricht limit.
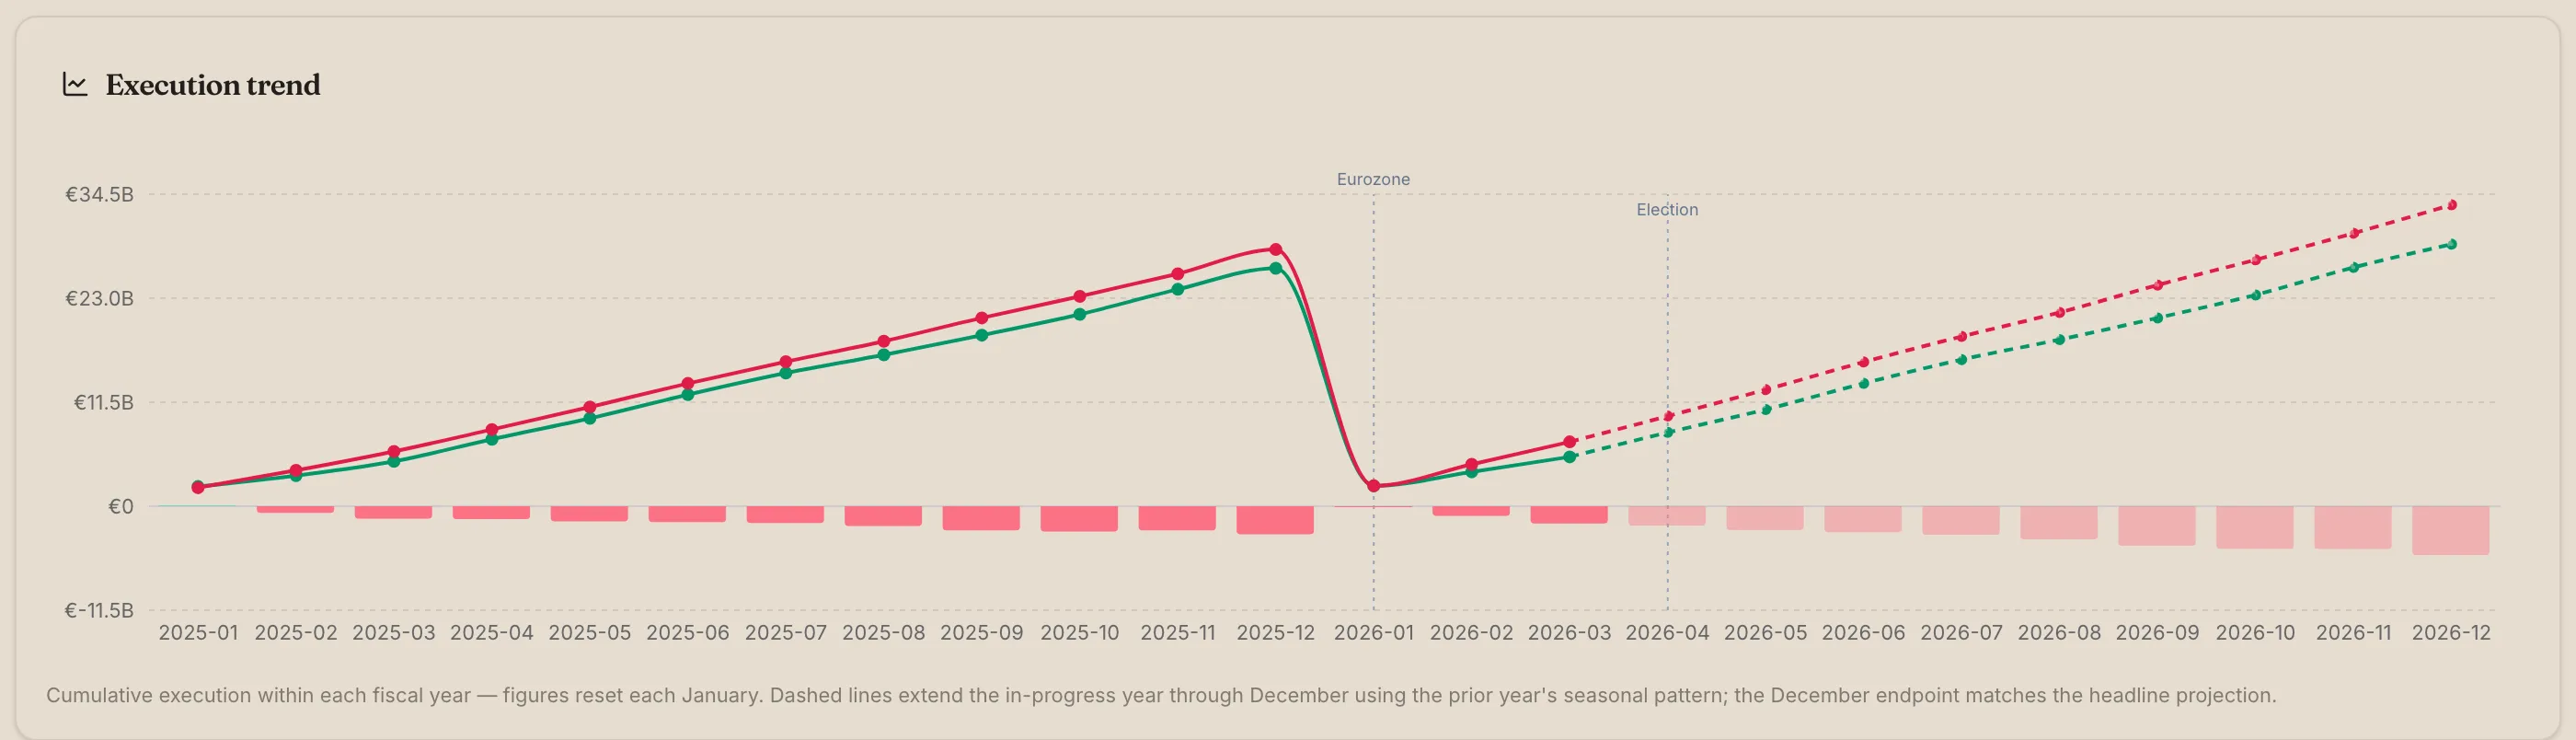
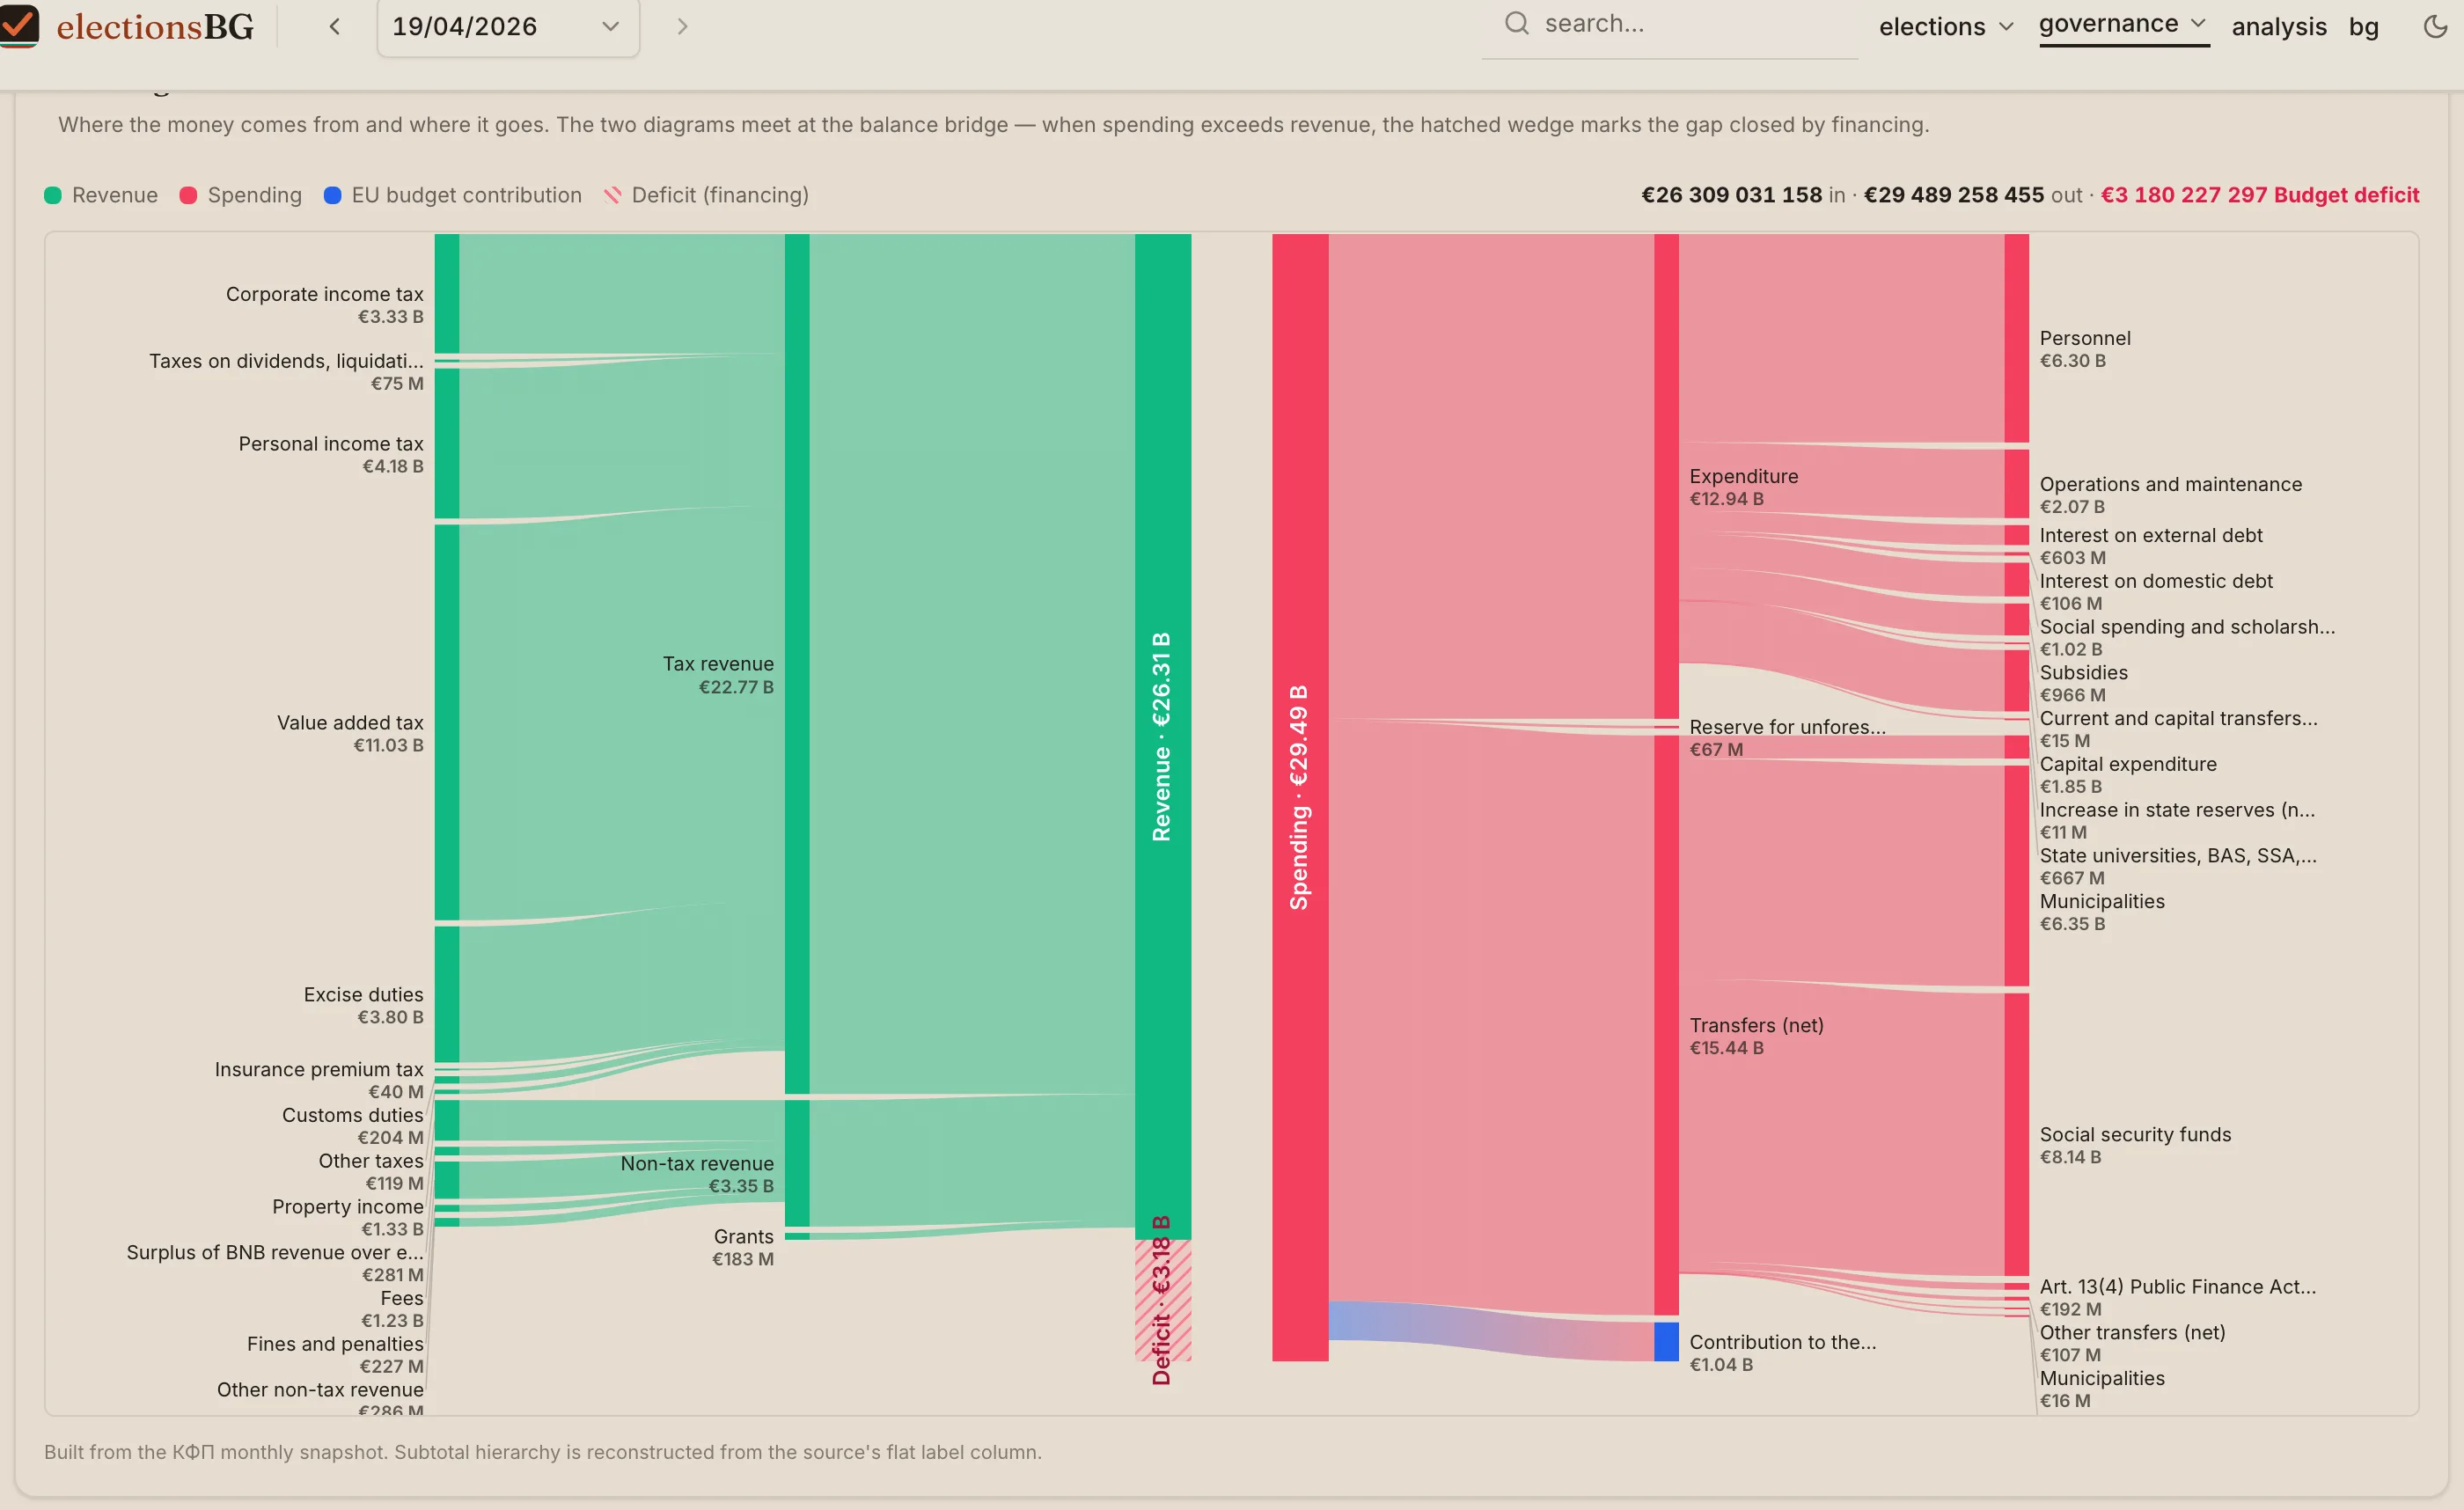
Where to look: The budget dashboard headline cards show live execution against plan, with peer-band chips for Bulgaria's position in the EU-27. The execution trend tile visualises the monthly path of revenue and expenditure with a forward-projection line through year-end.
Opportunities
O1 · Maastricht compliance and fiscal headroom — HIGH
Public debt 29.9% of GDP (rank 25 out of 26 in the EU — almost the lowest). Deficit 2.7% for 2025 (inside Maastricht). Total revenue 38.1% of GDP (well below the EU-27 average of 46.4%).
Bulgaria has fiscal headroom that most European peers don't. Low debt allows relatively cheap financing of long-term investments (judicial reform, energy, education, healthcare) without pressuring the current budget.
That headroom isn't infinite. Debt rose from under 15% of GDP before 2020 to close to 30% today. If the trajectory continues and pension/social pressures keep building, within 5–7 years the country could cross the point where the current fiscal advantage stops being meaningful.
Opportunity. The window in which fiscal space is still wide is a strategic moment for reforms that are unpopular in the short term but essential for long-run sustainability. This is especially true for the MОД debate (R1), the pension formula and revenue policy.
Where to look: The /budget headline cards show revenue, expenditure and the deficit as % of GDP, with Bulgaria's position against the EU-27.
O2 · High public-order spend — room for rebalancing — MEDIUM
Public order and safety: 2.8% of GDP (rank 2/26 in the EU, against the 1.7% EU-27 average). Roughly double the European mean.
Bulgaria spends heavily on police, prosecutors, courts and prisons. That doesn't automatically translate into effectiveness — World Bank governance indicators on rule of law and control of corruption show the functional quality of the system stays low (see the Governance dashboard).
Rebalancing opportunity. Reviewing the cost basis of this function (productivity gains, organisational restructuring, process digitalisation) would free up real resources to redirect into sectors with bigger long-run returns — education (R4), infrastructure investment, healthcare. Even a partial optimisation (converging to the EU-27 average while preserving functional quality) would free €800–900M annually.
Where to look: The Where money goes by function tile — "Public order and safety" is rendered with a high peer-band position in the EU.
O3 · Personal tax-bill calculator — citizen transparency — MEDIUM
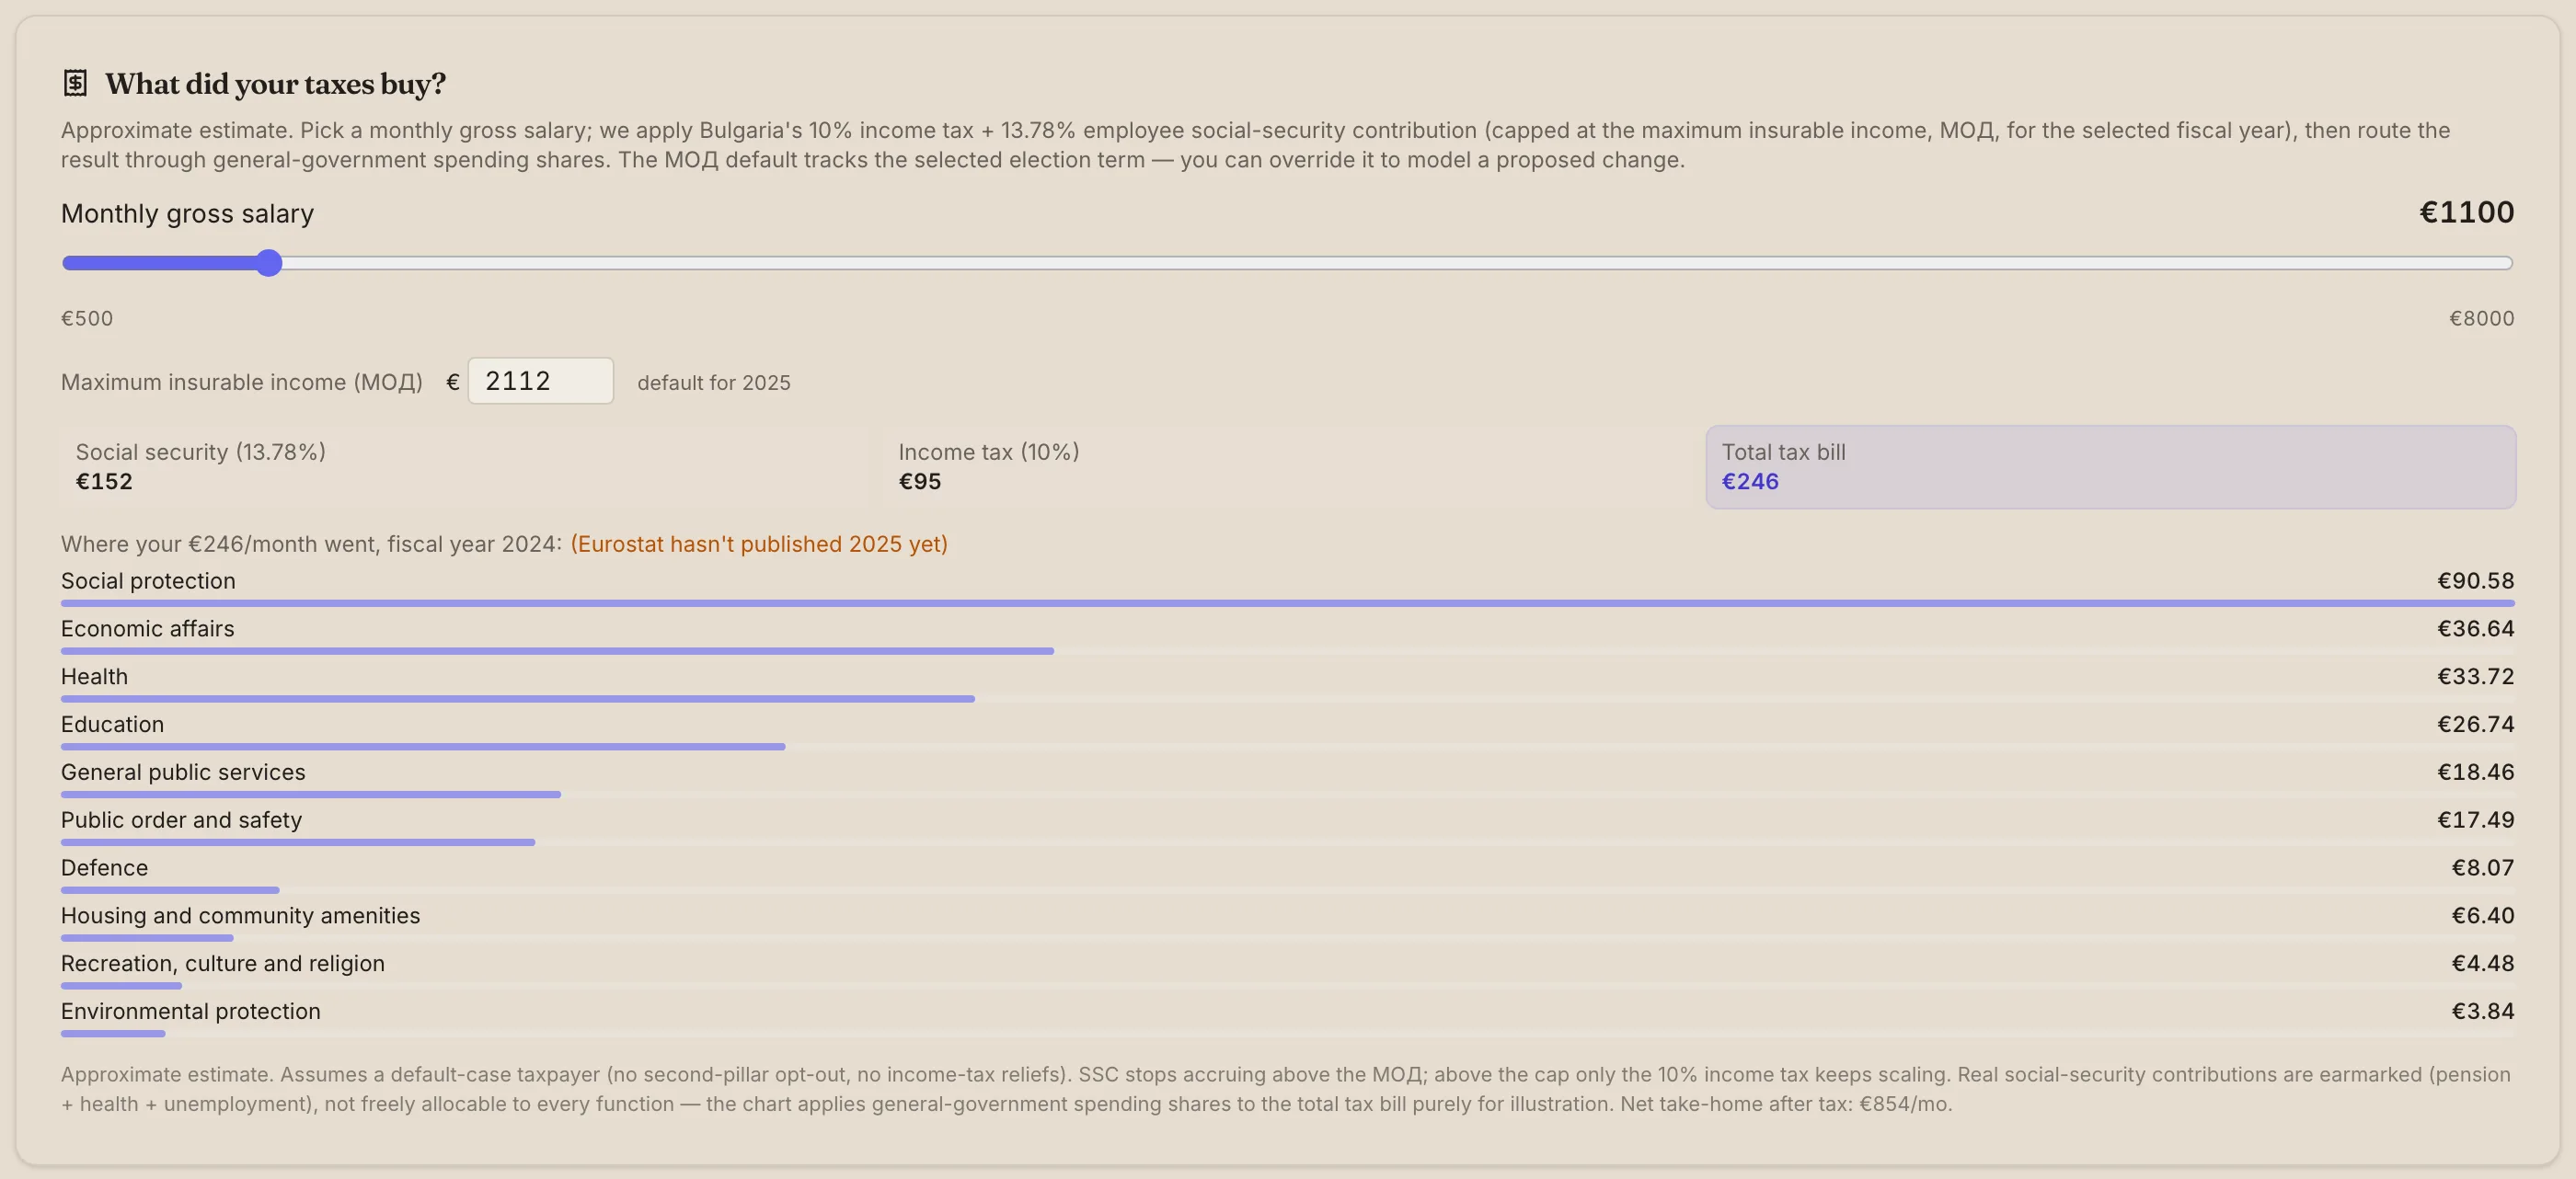
The new What did your taxes buy? calculator turns a monthly gross salary into a personalised breakdown of which government functions your taxes funded. Lets you test МОД scenarios (including the proposed €2,300 for 2026).
This is Bulgaria's first tool that takes a specific salary and answers concretely "where did your tax money go?" — function by function. Comparable tools in other countries (the NZ Treasury Income Explorer, the UK "Where Does My Money Go") consistently show this format has high civic value. Citizens engage much more with budget data when they see how it lands on their own paycheck.
Analytic opportunity. The calculator lets you directly compare the two МОД proposals (€2,300 vs €2,352) — just type in each value to see which is more burdensome on middle-high earners. Tools like this narrow the information asymmetry between public institutions and citizens.
Where to look: The What did your taxes buy? calculator in the Composition section. The МОД default tracks the selected election term.
O4 · Monthly public fiscal bulletin (КФП) — MEDIUM
The Finance Ministry publishes a monthly bulletin with current execution data. The dashboard auto-updates trends after every new release.
Regular monthly publication of budget data is a powerful executive-control tool. It allows systematic comparisons of plan against actual on a monthly and quarterly basis. Few European countries have this operational transparency at monthly granularity (most publish yearly or quarterly).
Opportunity. Tools like the Execution trend and the Same-point-last-year comparison turn the raw bulletin into indicators that anyone can track in real time without specialised knowledge.
Where to look: The Execution section — monthly trend, projection line, and prior-year same-period comparison.
O5 · Post-euro-adoption adaptation window — HIGH
Bulgaria adopted the euro on 1 January 2026. All budget parameters (МОД, minimum wage, contribution floors, ceilings) migrated to euro-converted values at the locked rate 1 EUR = 1.95583 BGN.
The technical transition to the euro was relatively smooth, but it created a "rethink" effect on many structural parameters. The current МОД debate is a direct product of that — before the changeover, МОД was BGN 4,130 (set 1 April 2025). The mechanical conversion gives €2,111.64, but rounding up to €2,300 is a much bigger step that would normally require a separate political decision.
Reform window. The first 18 months after eurozone entry are a natural window to revisit structural quirks of the budget model — the ECB's fiscal-rule anchors provide external discipline that lowers the political cost of unpopular reforms. This is especially valid for the pension formula, contribution thresholds and tax policy, which until now have been hard to change for purely domestic reasons.
Where to look: All budget modules now display values directly in euros. The Legislative path section tracks the timeline of current budget laws, amendments and pending decisions.
Summary
| Category | High | Medium | Low | Total |
|---|---|---|---|---|
| Risks | R1, R3 | R2, R4 | R5 | 5 |
| Opportunities | O1, O5 | O2, O3, O4 | — | 5 |
The current situation around budget 2026 shows that risks and opportunities are deeply linked. Raising МОД (R1) is a direct response to demographic pressure and the rising pension obligation that flow from the structural concentration in social functions (R3). At the same time, fiscal headroom (O1) and the post-eurozone window (O5) open a path for broader reforms that would address the imbalances behind R3 and R4 without relying solely on tax and contribution hikes.
The key decision facing the executive is whether to use partial corrections (МОД bumps, pension indexation) or deep structural reforms (rethinking the pension formula, rebalancing functional spending shares, investing in education and innovation). The first approach is politically easier; the second is what long-term sustainability requires.
Resources and further analysis
- Budget dashboard — live values for every indicator discussed here, with the interactive calculator and EU-27 peer comparison.
- Governance dashboard — context for political instability, institutional trust and World Bank governance indicators.
- Governance scorecard — the analytical companion from the governance side (seven risks, six opportunities).
- Methodology notes. Cash data come from the Finance Ministry's monthly bulletin (data.egov.bg), plan-vs-actual comparisons from Държавен вестник and the per-ministry execution reports, and functional classification from Eurostat gov_10a_exp. A full source review lives on the About page.