A governance scorecard for Bulgaria — seven risks, six opportunities
Published: 2026-05-18
A structured read of Bulgarian governance, pinned to specific tiles on the /governance dashboard. What the data says about cabinet stability, institutional trust, WGI scores, debt and budget — and where on the dashboard to check live values.
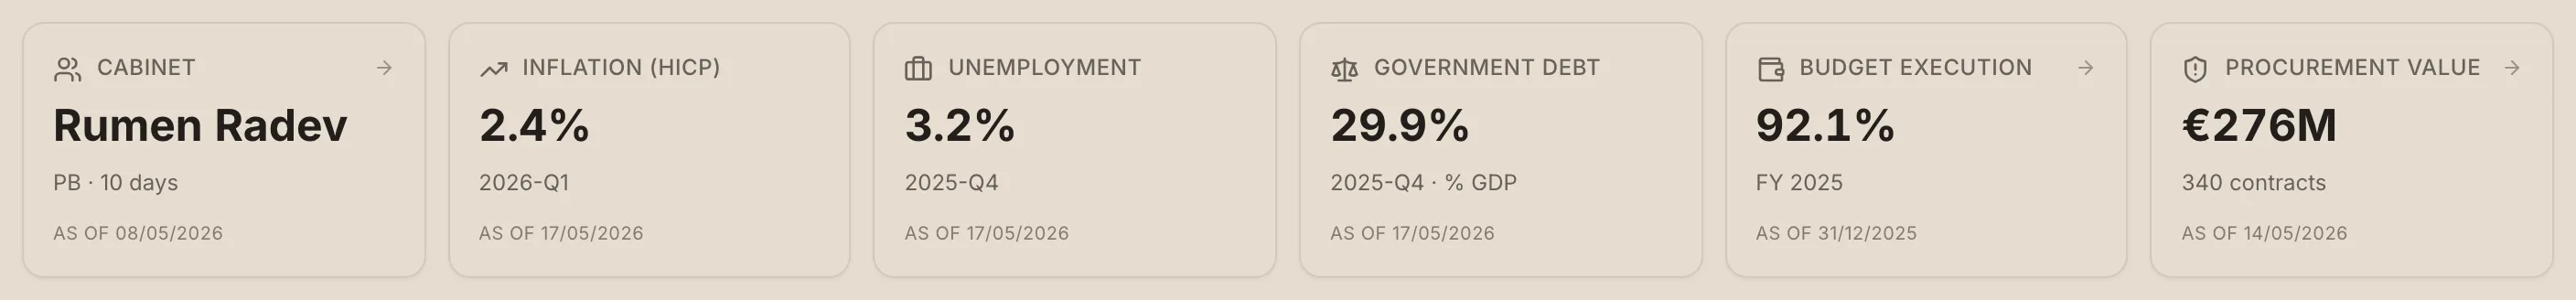
Bulgaria runs one of the EU's most stable economies on top of one of its most unstable governments. Debt sits at 29.9% of GDP — among the lowest in the bloc. Inflation is back to 2.4%. Unemployment is 3.2%. And yet, since 2005, the country has been governed by 18 different cabinets, 15 of which ended early, while Eurobarometer trust in the national parliament has fallen below 15% in several recent years.
This piece is a scorecard. Seven risks and six opportunities, each pinned to a specific tile on the Governance dashboard and to the underlying dataset. The goal is not to grade the current government — the goal is to make the gap between what Bulgaria is doing well and where it is sliding legible at a glance.
How to read the scorecard
Each entry has three parts: the finding (the numbers from the data), the severity or impact rating (high / medium / low), and the dashboard tile to inspect for live values. All numbers in this article were valid as of 17–18 May 2026. They will move; the dashboard does not — load it any time to see the current state.
Release cadences differ across the series cited here. Eurostat macro indicators refresh quarterly — the latest values are 2025-Q4 or 2026-Q1 depending on the series. The World Bank's WGI scores and Eurobarometer trust surveys are annual, currently at the 2024 vintage, with the next update expected in autumn 2026. That means R2 and R3 should be read with the caveat that election-year movements are not yet in the data.
The underlying sources, all published openly: the Court of Audit (Сметна палата) declarations registry, the Commerce Registry, the Public Procurement Agency (АОП), the Ministry of Finance's monthly fiscal bulletin (КФП), parliament.bg roll-call records, Eurostat (macroeconomic, fiscal and peer-country aggregates), the World Bank's Worldwide Governance Indicators, Eurobarometer trust surveys, OSCE/ODIHR mission reports, and the BNB government-securities auction feed for sovereign debt. The dashboard consolidates them; this scorecard reads across them.
Risks
R1 · Cabinet churn — HIGH
15 of 18 cabinets since 2005 ended early. The longest regular cabinet (Borisov III) ran 4 years; the shortest (Petkov) lasted 232 days.
Bulgaria has had 18 cabinets in 21 years. Nine were regular, nine were caretaker. Breaking the regular cabinets down by how they ended: nine dissolved into a snap election, four ended in resignation, one in a no-confidence vote, one in a failed parliamentary rotation, and only one completed a full term. The current regular cabinet under Rumen Radev was elected by the National Assembly on 8 May 2026 after the 19 April snap election (122 in favour, 70 against, 36 abstaining); it succeeds the Gyurov caretaker administration, which was the ninth caretaker cabinet since 2005.
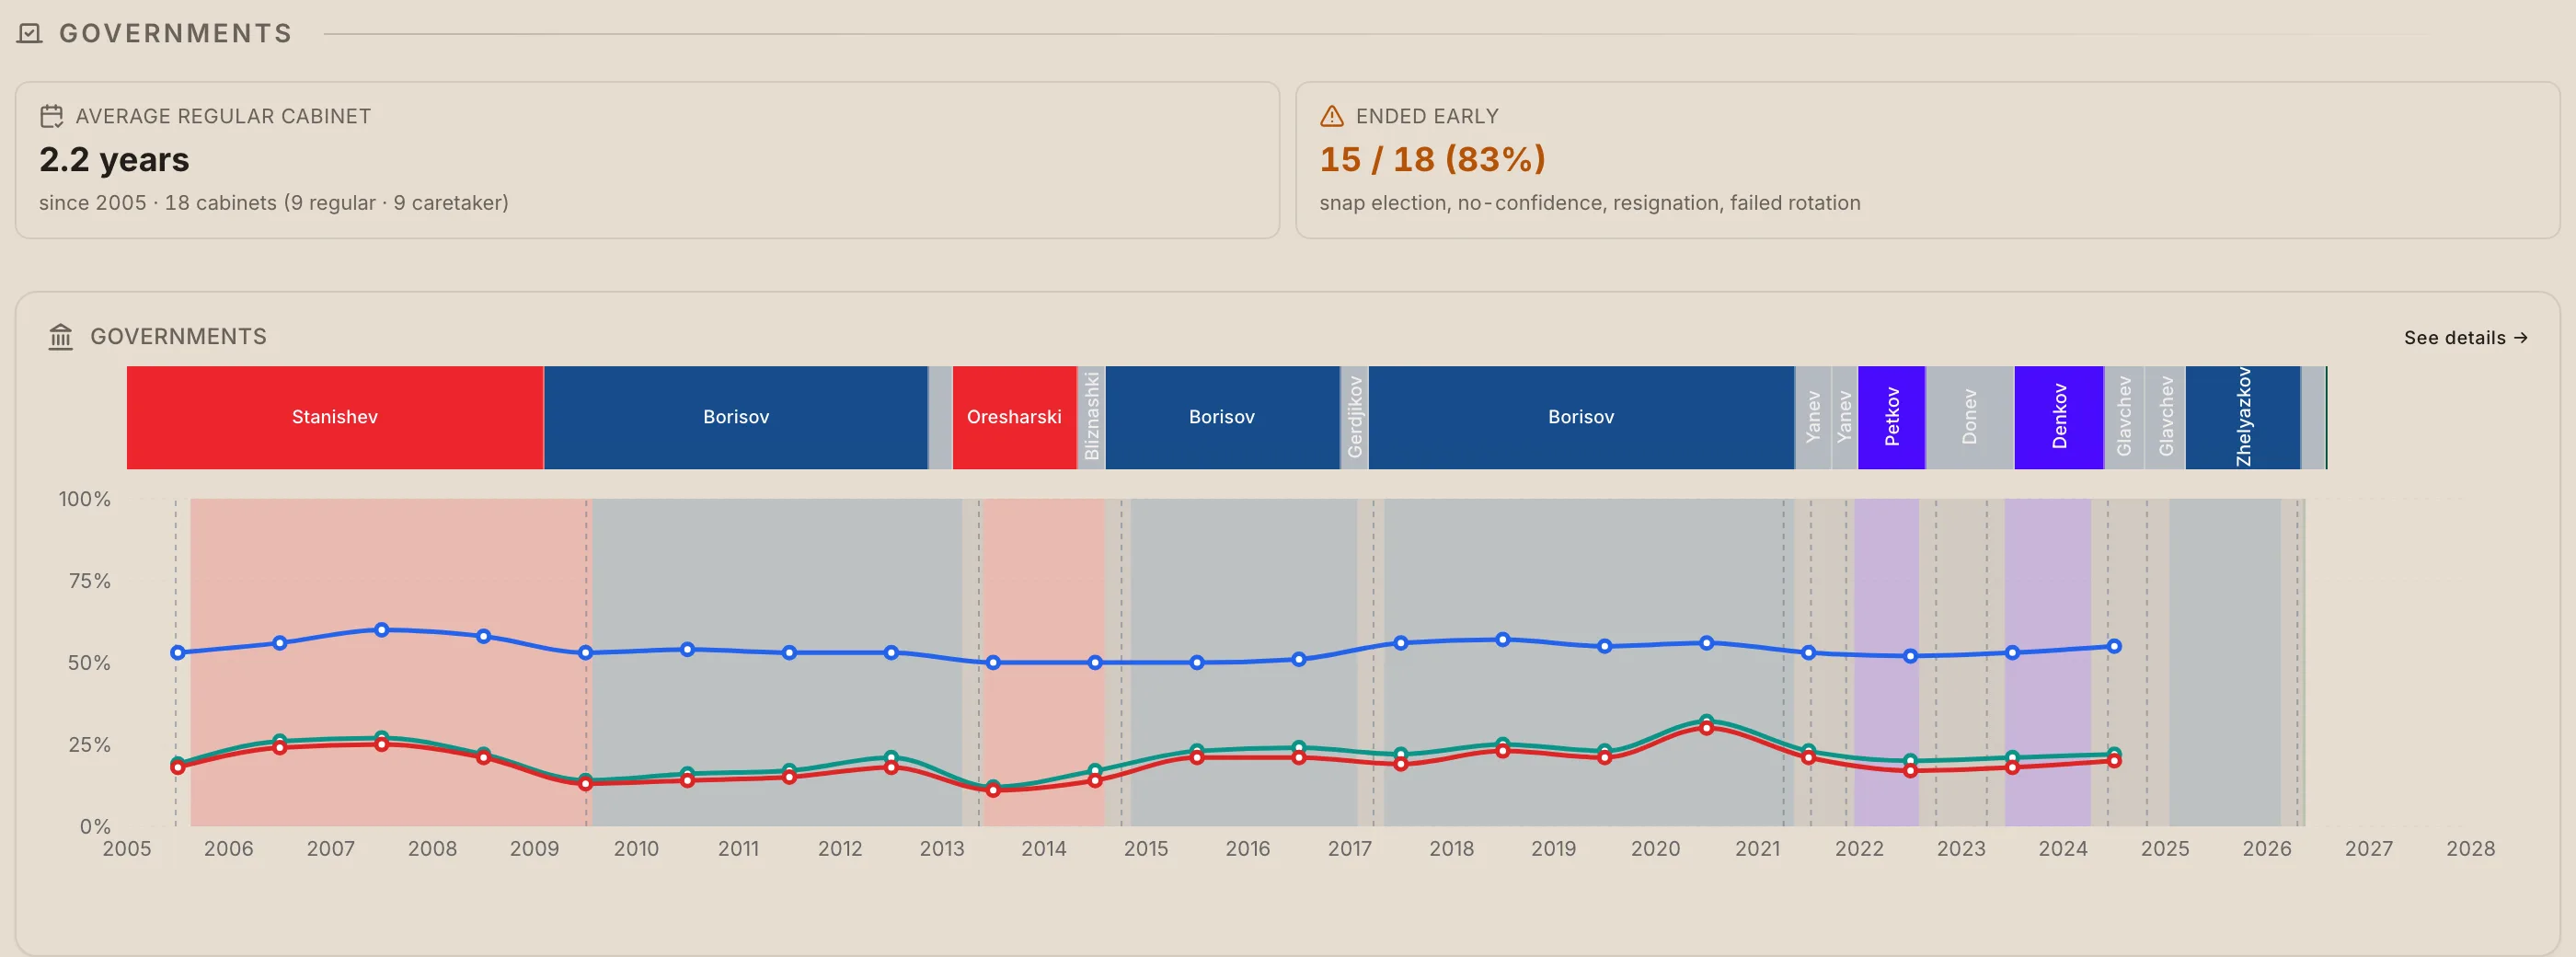
The compressed stat strip at the top of the Governments section reduces 21 years of governance turnover to two numbers: 2.2 years average regular-cabinet duration, and 83% of all cabinets ending before their scheduled term. The cabinet bands underneath show which cabinets and when — Borisov dominated 2009–2021, the 2021–2024 stretch fragmented into six elections, and the 19/04/2026 cycle has just begun.
Cost. Every snap election costs roughly €18M in administration alone (CEC figures), but the structural cost is much larger: ministries cycle through political leadership too fast to implement multi-year reforms, EU funds absorption stalls during caretaker stretches, and accession-conditional milestones (Schengen full membership, Eurozone, OECD) repeatedly miss their windows.
Where to look: Governments section of the dashboard (the trust chart overlaid on the cabinet bands is described in R2).
R2 · Trust deficit — HIGH
Eurobarometer trust in the national parliament fell to 11% in 2013 and remained at 20% in 2024. Trust in the national government tracks the same floor. Trust in the EU averages 54% across all available years.
The new line chart on the cabinet timeline overlays three Eurobarometer series — trustParliament, trustGovernment, trustEu — onto the same 21-year axis. The pattern is consistent: domestic institutions oscillate between roughly 12% and 30%; the EU sits at 45–60%. Bulgaria's most-trusted institution is the one it does not directly elect.
This matters because a government that scores below 25% on trust cannot ask the public to bear short-term costs (judicial reform, energy-price unwinding, demographic adjustment, defence spending). The legitimacy budget has been spent. The only reliable anchor is the EU framework — which the macro section's trust trio confirms.
Where to look: the cabinet-timeline chart — the blue line is trust in the EU; the red and teal lines are trust in parliament and government. The Eurobarometer source is published twice yearly; the dashboard shows the annual mean.
R3 · Governance quality is sliding — MEDIUM-HIGH
WGI Rule of Law: -0.03 (2024, down 0.01 vs prior). Control of Corruption: -0.24 (down 0.09). Government Effectiveness: 0.04 (down 0.06).
The World Bank's Worldwide Governance Indicators score countries on a roughly -2.5 to +2.5 scale. Bulgaria sits slightly below zero on Rule of Law, clearly below zero on Control of Corruption, and just above zero on Government Effectiveness. All three deteriorated in the most recent annual update.
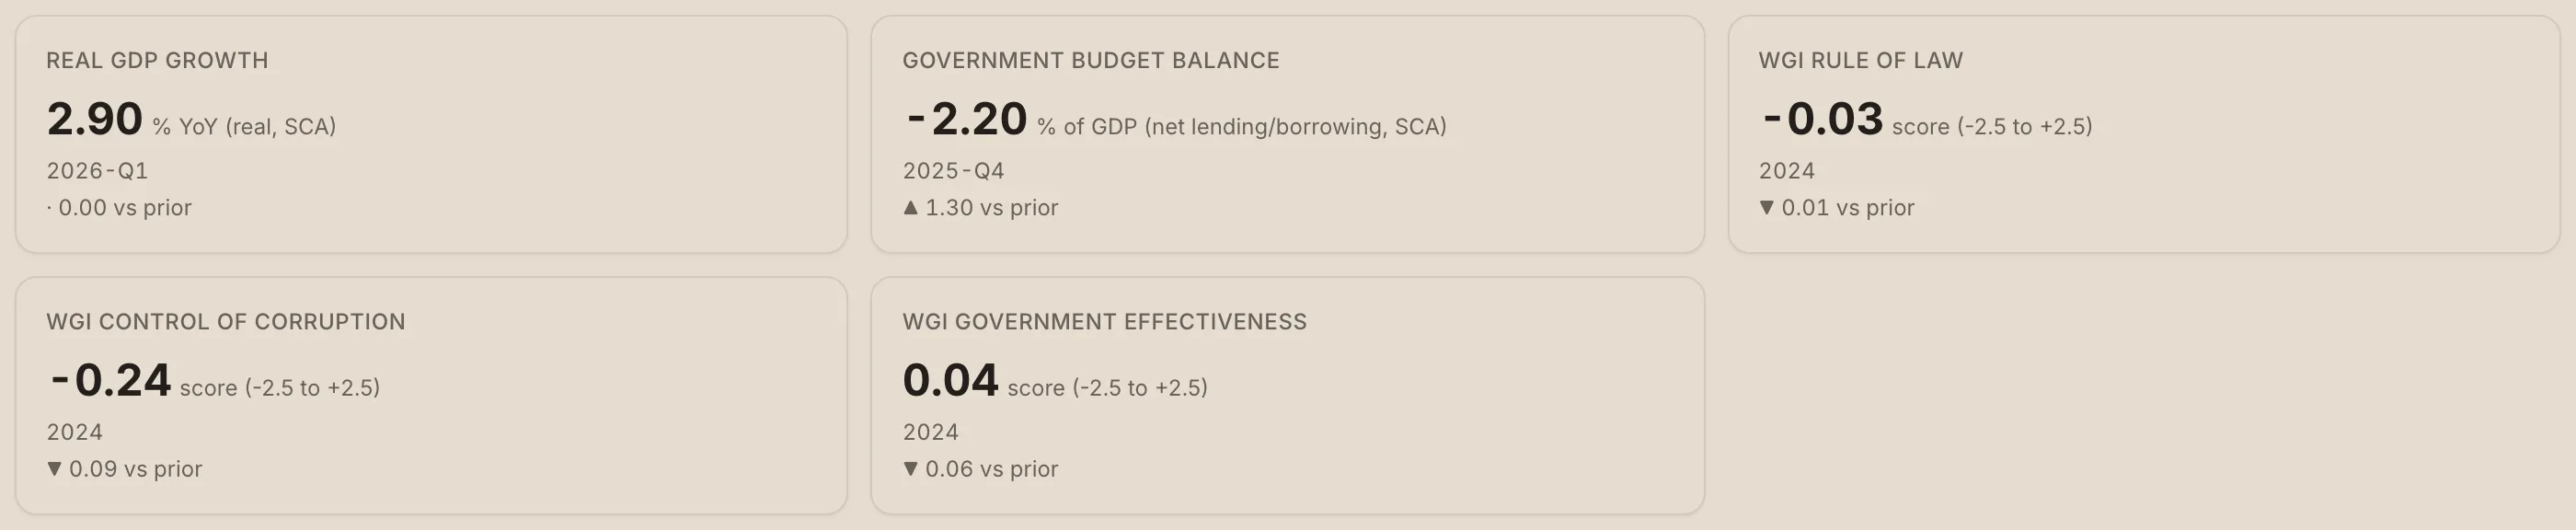
These numbers are not catastrophic — Romania scores worse on Control of Corruption, Hungary worse on Rule of Law — but the direction is the warning. Three consecutive years of decline means the institutional erosion is steady, not cyclical. Each WGI tile shows the year-over-year delta in the footer for exactly this reason.
Where to look: the Macro & regional context section, second row of indicator cards.
R4 · Expensive debt despite the low ratio — MEDIUM
Latest Eurobond: €1.2bn at 4.36% yield, 20-year. Latest domestic ДЦК: €210M at 4.34% yield, 10-year. Total raised internationally in 2024–2025: €11.58bn.
Bulgaria's headline debt-to-GDP figure is wonderful: 29.9%, well inside the Maastricht 60% ceiling and roughly half the EU27 average. The catch is the yield curve. For a 20-year Eurobond in mid-2025, the Republic settled at 4.36% — roughly 150 basis points above the German Bund of the same maturity. The domestic auctions clear at similar levels.

That spread is the governance discount investors price in. At current debt levels it is manageable — Bulgaria can comfortably service €100M+ in annual yield differential. But if debt grows (and it has, from <15% pre-2020 to 30% now) the cost compounds, and the yield itself will move with WGI scores, election cycles, and EU framework health.
Where to look: the Recent debt sales tile in the macro section. The full table is on the Indicators page.
R5 · Procurement concentration — MEDIUM
€275.7M across 340 contracts active this parliamentary term. The top contractor (СК БИЛДИНГ АД) holds €46.7M — 16.9% of the total.
The procurement feed scoped to the 19/04/2026 election shows a long tail dominated by a small number of large contractors. The dashboard also surfaces the connection between contractors and seated MPs via the Top MPs by procurement tile (when the connection graph has matches for the current term).
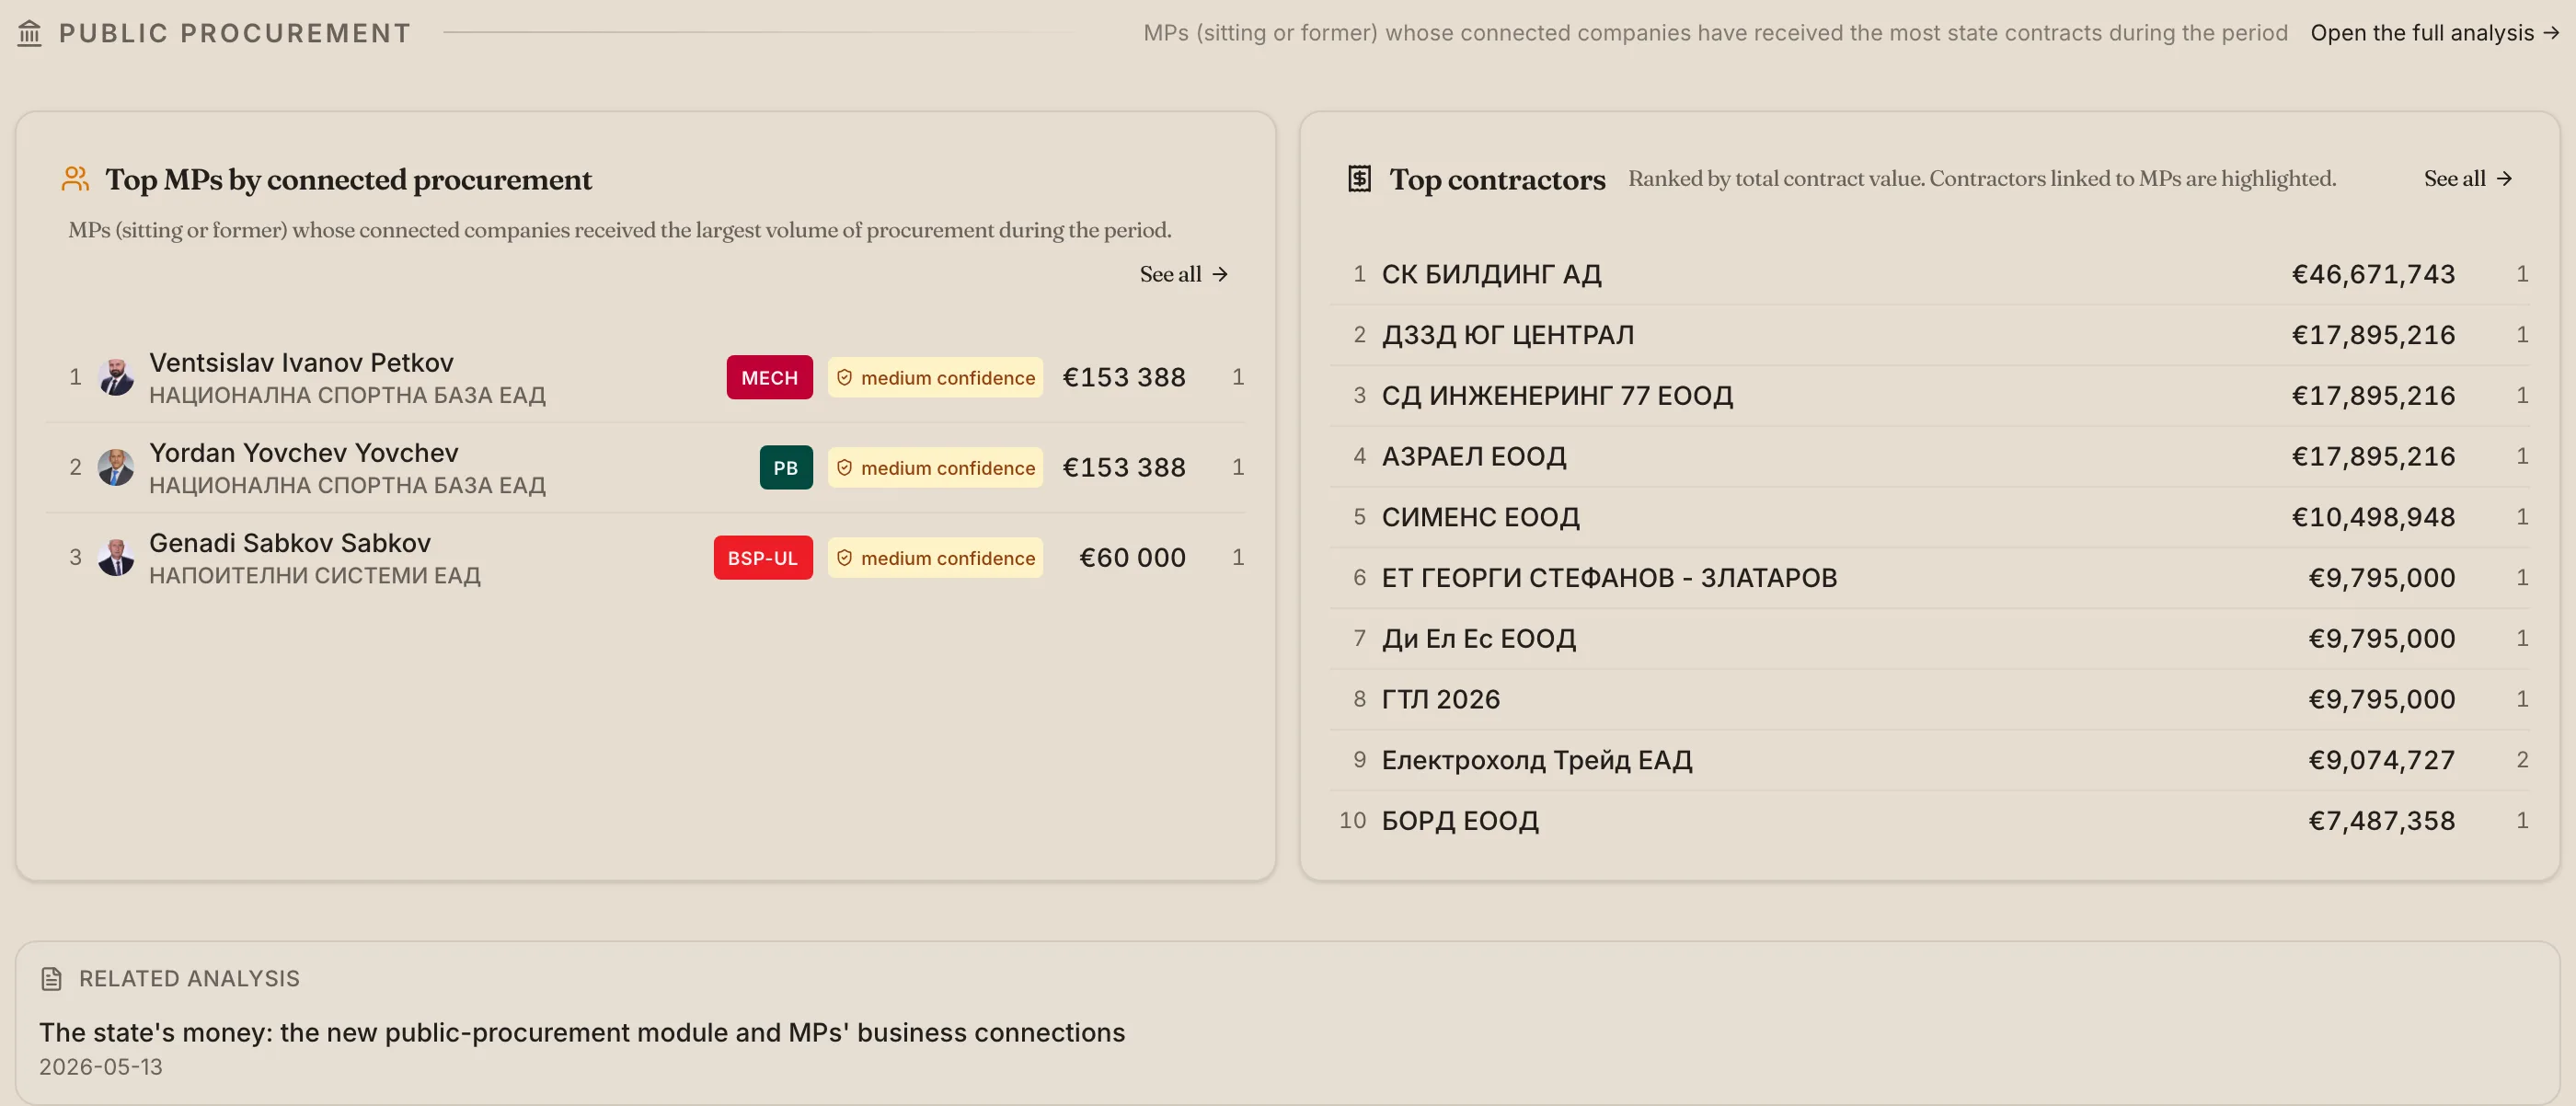
Cost. Procurement concentration is not corruption — many contractors are legitimately the only firms with the capacity to deliver large infrastructure work. But concentration plus connection (R6 below) is the combination to watch. The dashboard makes both numbers visible in the same view so the pattern is harder to miss.
Where to look: the Public procurement section.
R6 · Declared assets and business ties — MEDIUM-LOW
Top MP by declared net worth: Delyan Slavchev Peevski (€11.0M). Top MP by business-connection count: Ivelin Lyudmilov Mihaylov (58 connections). Top non-MP official by declared assets: Valeri Teofilov Simeonov (€9.5M).
The declarations section consolidates three rankings that were previously scattered across the Court of Audit (Сметна палата) registry and the Commerce Registry: MP business connections, MP declared net worth, and non-MP officials' declared net worth.
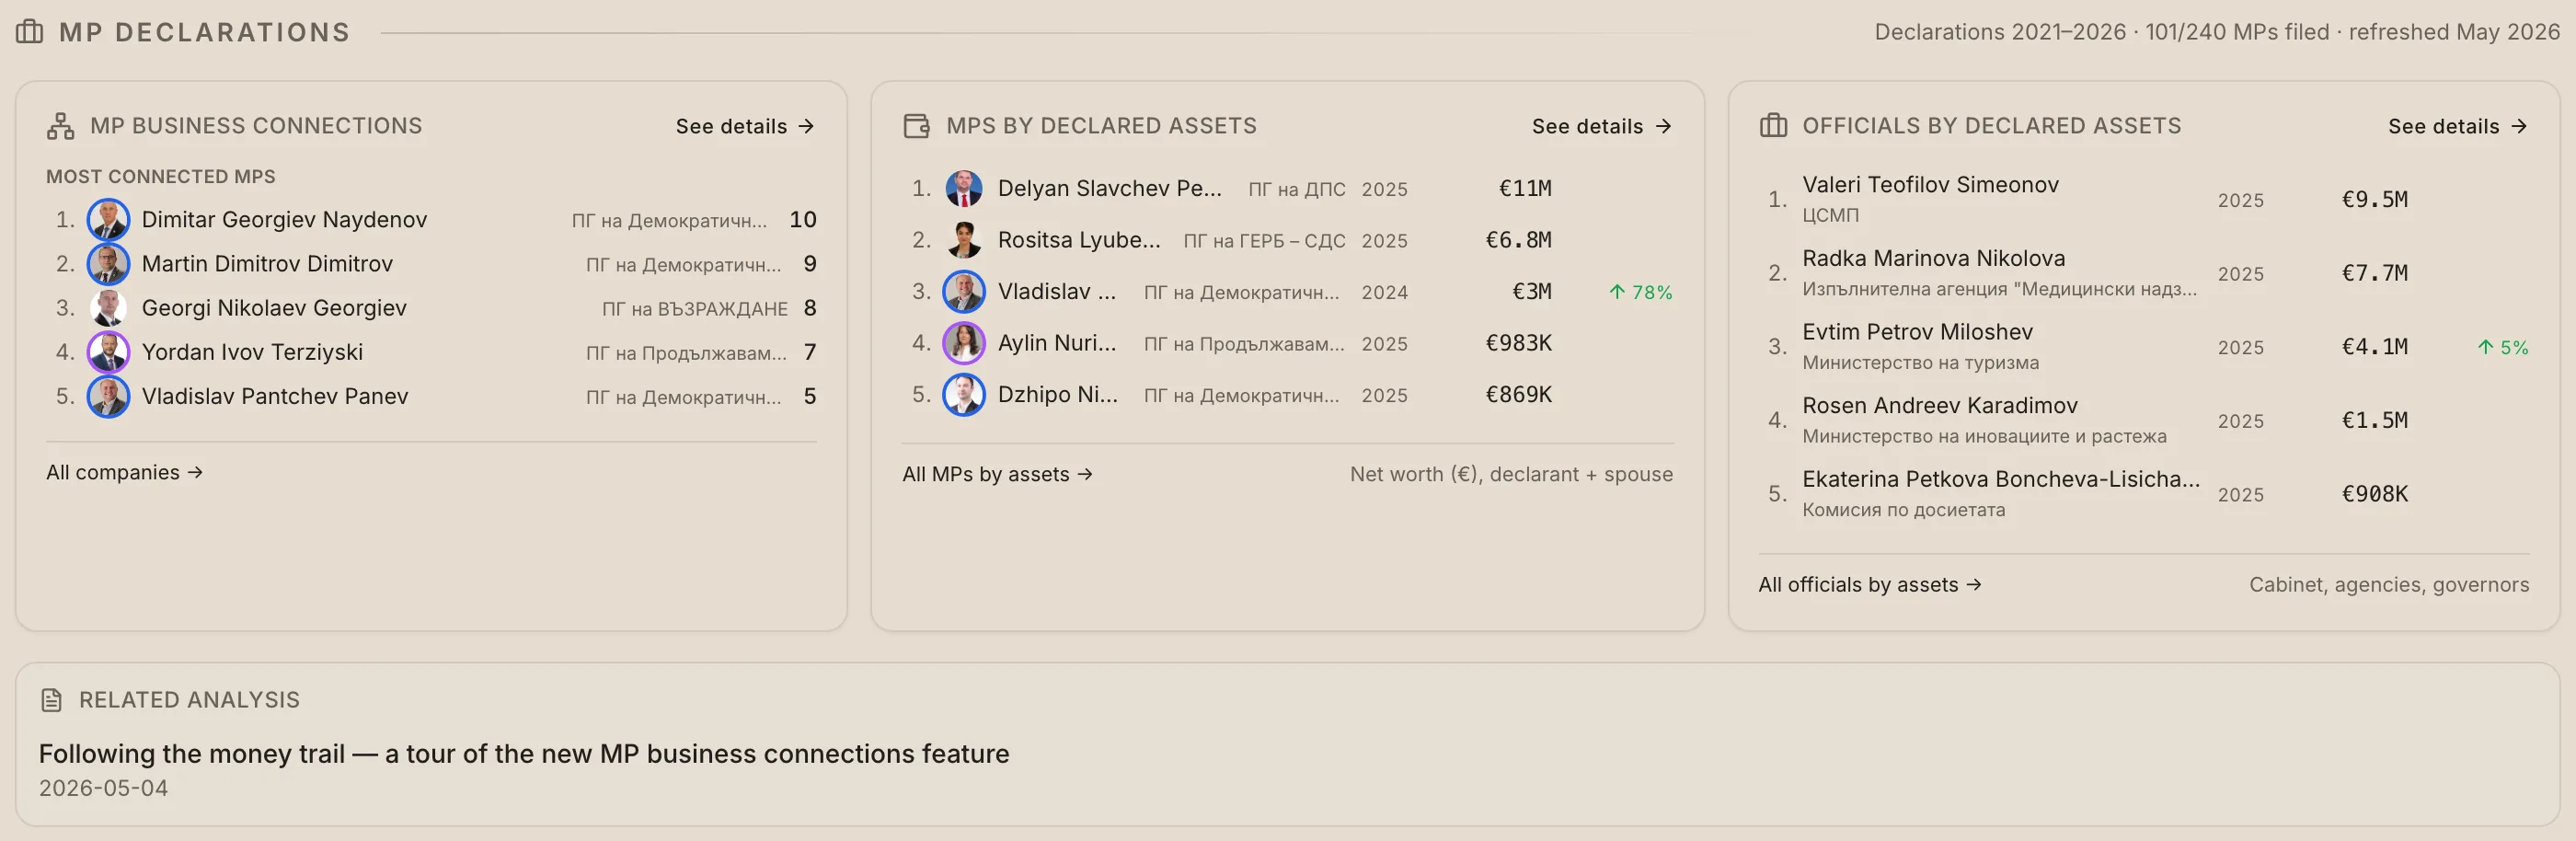
Cost. None of these numbers are themselves a violation — declarations are a transparency mechanism, not a verdict. The risk is that the public-facing data is dense enough that no journalist or watchdog can keep all of it in their head. The dashboard surfaces the top of each ranking so the most prominent cases are visible by default; the full datasets are linked from each tile.
Where to look: the Declarations section. Each tile deep-links to the full ranking.
R7 · Election integrity — LOW-MEDIUM
Latest OSCE/ODIHR mission (LEOM, 19/04/2026): preliminary statement notes that voters had a genuine choice and the campaign was active, while reform recommendations from prior cycles remain only partly addressed.
The Office for Democratic Institutions and Human Rights has observed every Bulgarian parliamentary election since 2005. The latest mission was a Limited Election Observation Mission (LEOM) — a smaller footprint than a full EOM, but still authoritative on the campaign environment, the legal framework, and voter-list handling.
The summary excerpt on the dashboard captures the diplomatic phrasing: the election was free and pluralistic, but earlier-cycle reform recommendations are still only partly implemented. That gap — between knowing what to fix and actually fixing it — is the through-line of the entire scorecard.
Where to look: the Latest OSCE/ODIHR finding tile in the macro section. The full report is linked from the tile and the Observations page lists every mission since 2005.
Opportunities
O1 · Fiscal headroom — HIGH
BG revenue 38.1% of GDP vs EU27 46.4%. Expenditure 41.7% vs EU27 49.5%. Debt 29.9% vs EU27 ~80%.
Bulgaria is a small-state economy. Both revenue and spending sit roughly 8 percentage points below the EU27 average. Combined with the low debt level, this is the most unambiguous strength in the scorecard: Bulgaria has fiscal room that most EU peers do not.
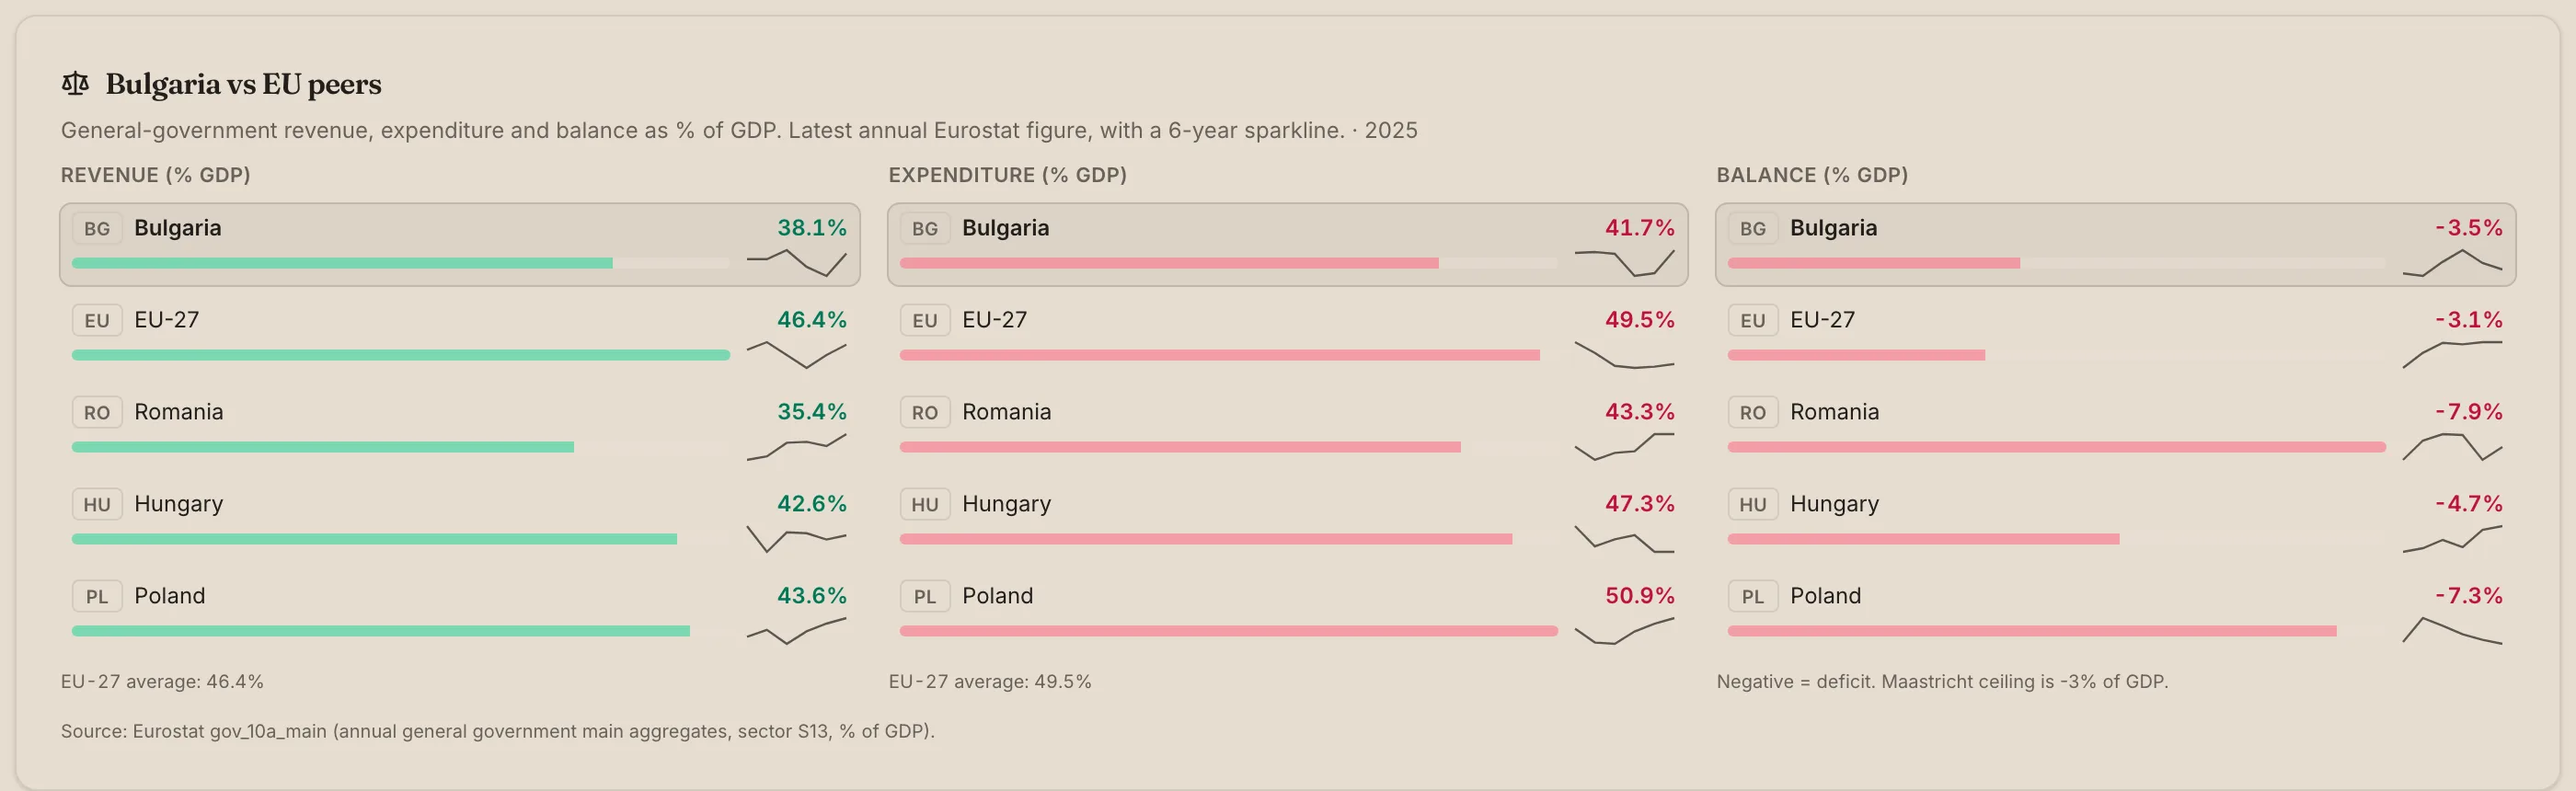
That room can be deployed two ways: lower taxes to keep the small-state model, or higher productive spending (infrastructure, education, R&D) to close the convergence gap with Western Europe. The peer-comparison tile shows both candidates for the spend-up scenario: Romania, Hungary, Poland all run substantially higher expenditure-to-GDP, and not all of that is waste.
The current budget balance — -2.2% of GDP at 2025-Q4 — is comfortably inside the Maastricht 3% ceiling, with cyclical recovery still pulling revenue up.
Where to look: the Bulgaria vs EU peers tile, just below the OSCE/ODIHR row in the macro section.
O2 · Macro stability gives reform space — HIGH
Inflation 2.4% (back inside ECB target band). Unemployment 3.2% (near full employment). Real GDP growth 2.9% YoY at 2026-Q1.
For most of the 2010s and early 2020s, Bulgarian governments faced reform proposals against a backdrop of fiscal crisis, financial-sector turmoil (KTB 2014), pandemic disruption, or post-invasion inflation. None of those headwinds is currently active. The macro environment now is the most reform-friendly it has been since accession.
The cabinet that grasps this window has cover to push hard items — judicial reform, energy-price unwinding from state utilities, demographic-adjustment of pensions and labour migration — without the public hearing "and we are doing this during a crisis." The headline strip at the top of the dashboard summarises the window in six numbers.
One caveat from the Q1 2026 composition. The 2.4% headline is composition-driven: services still print 3.1% and food 4.1%, with core inflation at 1.9%. Energy disinflation (-0.3%) does the rest of the work to keep the index inside the ECB band. The macro reading is benign on net, not uniformly so — what a household feels depends on how much of its basket is food and services.
Where to look: the headline indicator strip at the top of the governance dashboard.
O3 · Strategic EU integrations are in reach — HIGH
Schengen full membership (overland access) is gated on rule-of-law milestones already mapped. Eurozone path requires inflation discipline already achieved. OECD accession is in active negotiation.
This is the asymmetric opportunity. Each of these three integrations — Schengen full, Eurozone, OECD — would shift Bulgaria's risk premium permanently (R4 above), unlock structural funds, and act as an external commitment device that survives cabinet turnover. The conditions are mostly met. The blockers are domestic governance reforms that have been recommended by OSCE/ODIHR, the European Commission, and the OECD itself, year after year.
The dashboard does not yet have a dedicated integration-progress tile — but R2 (trust in EU at 54% as the anchor) and R7 (OSCE recommendations partly addressed) are the two signals to watch.
Where to look: Latest OSCE/ODIHR finding and the Trust in the EU line on the cabinet-timeline chart.
O4 · Parliament voting is now transparent — MEDIUM
The 51st National Assembly's roll-call data feeds a party correlation matrix and an MP embedding (UMAP of voting vectors) that surfaces cross-bench cooperation patterns.
Until recently, "what does parliament actually vote on?" required pulling minutes from parliament.bg and reconciling MP names. The dashboard now ships two analytical views that compress thousands of votes into a glanceable summary: a cosine-similarity heatmap between party groups, and an embedding that shows which MPs vote outside their group's line.
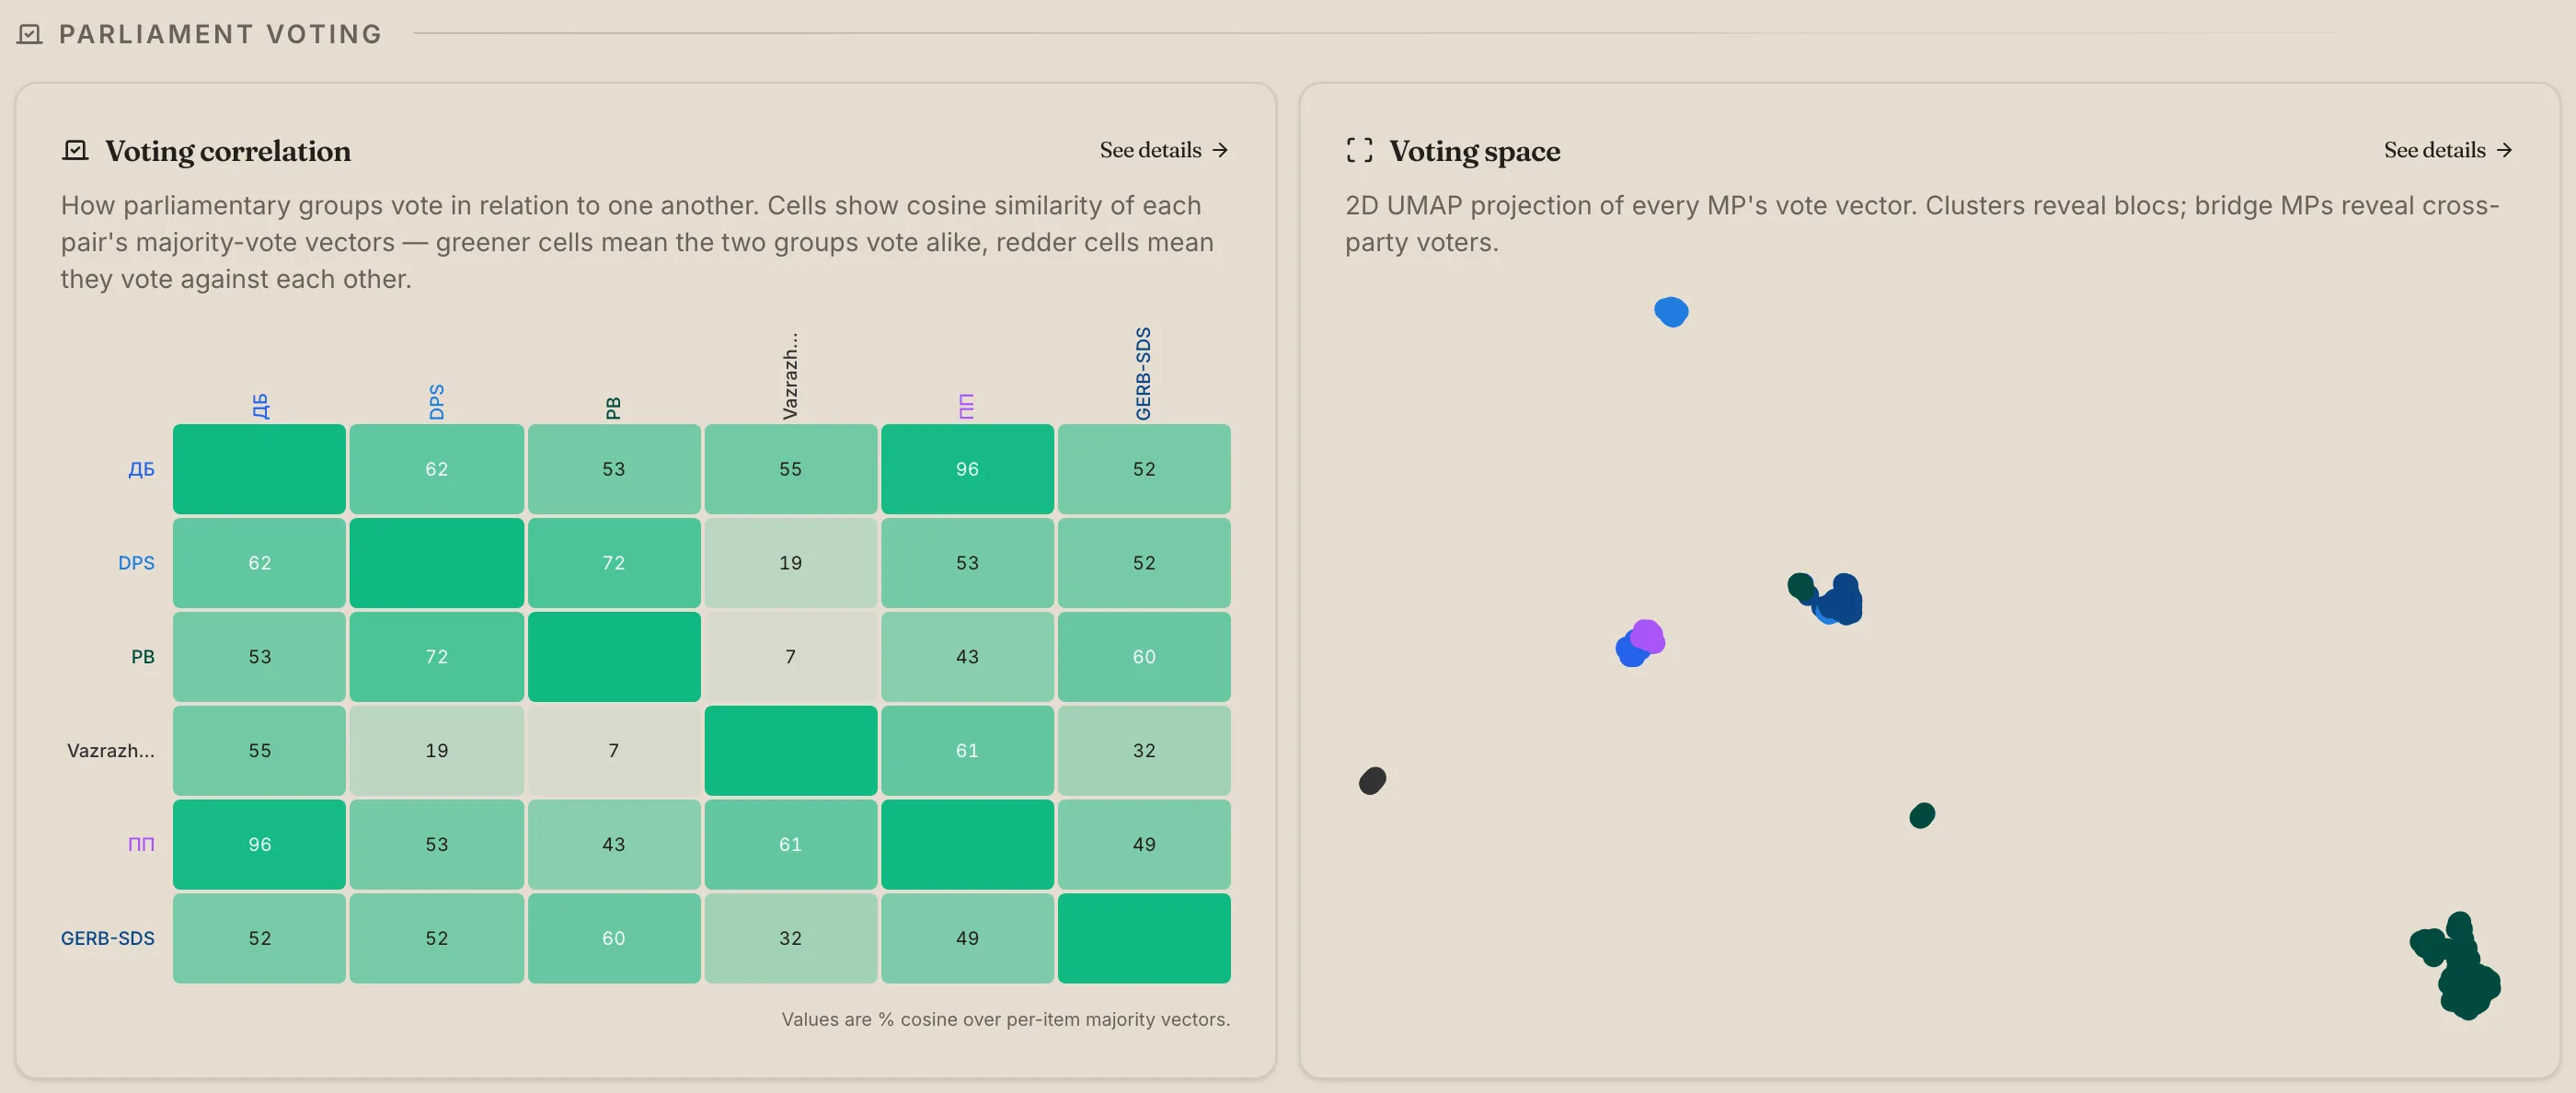
For coalition-builders, journalists, and voters, this is leverage. It is much harder for a party to claim opposition to a bill that the heatmap shows it voted with the majority on; it is much easier to spot the "bridge MPs" who anchor unlikely coalitions.
Where to look: the Parliament voting section. Each tile deep-links to its own zoomable view.
O5 · The watchdog stack already exists — MEDIUM
Declarations (Сметна палата), Commerce Registry (Министерство на правосъдието), Public Procurement Agency (АОП), state budget execution (МФ КФП), parliament roll-calls — all open, all on this dashboard.
Bulgaria's data-transparency infrastructure is, surprisingly, better than most EU peers'. The declarations registry is fully digital, the Commerce Registry is queryable, the procurement feed is daily-updated, and roll-call data is bulk-downloadable. The bottleneck is stitching, not raw access.
The dashboard's value is not new data — it is connections. Cabinet timeline ↔ trust ↔ WGI ↔ budget ↔ debt ↔ procurement ↔ declarations ↔ observations, all on one page, all interlinked. That stitching is what turns a transparency stack into a transparency practice.
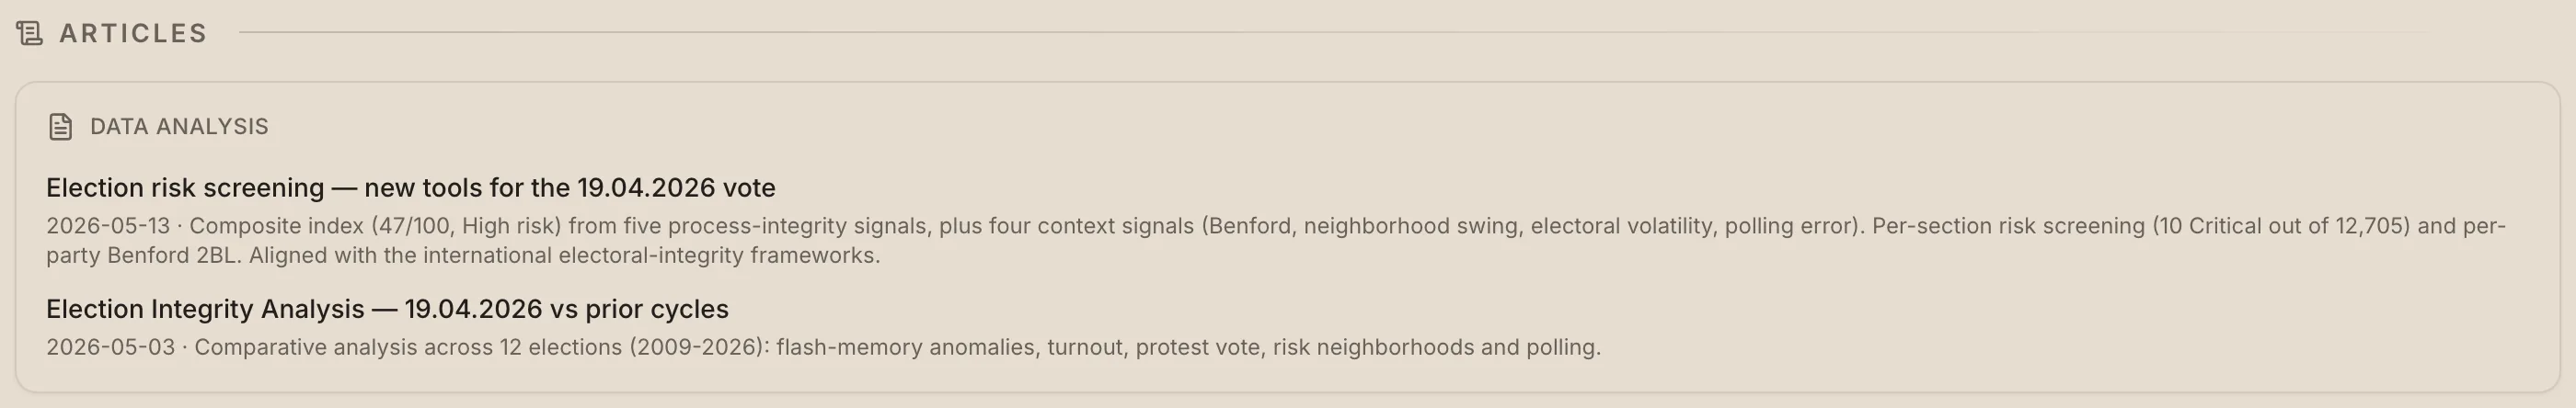
Where to look: every section. The Articles tile at the bottom (this very article should surface there) is the index of long-form analyses across the stack.
O6 · Budget execution discipline is high — MEDIUM
Budget execution: 92.1% of plan for FY 2025. Multi-year trend shows revenue and expenditure both growing — no sudden underspending, no fiscal-cliff dynamics.
This is the quiet structural strength. Despite the cabinet churn, the apparatus of state budget execution has held together. 92.1% is a healthy print — neither over- nor under-spent — and the multi-year trend (Eurostat ESA, general-government scope) shows steady growth on both sides. The deficit widens modestly in 2024–2025 reflecting wage and pension indexation, not loss of control.
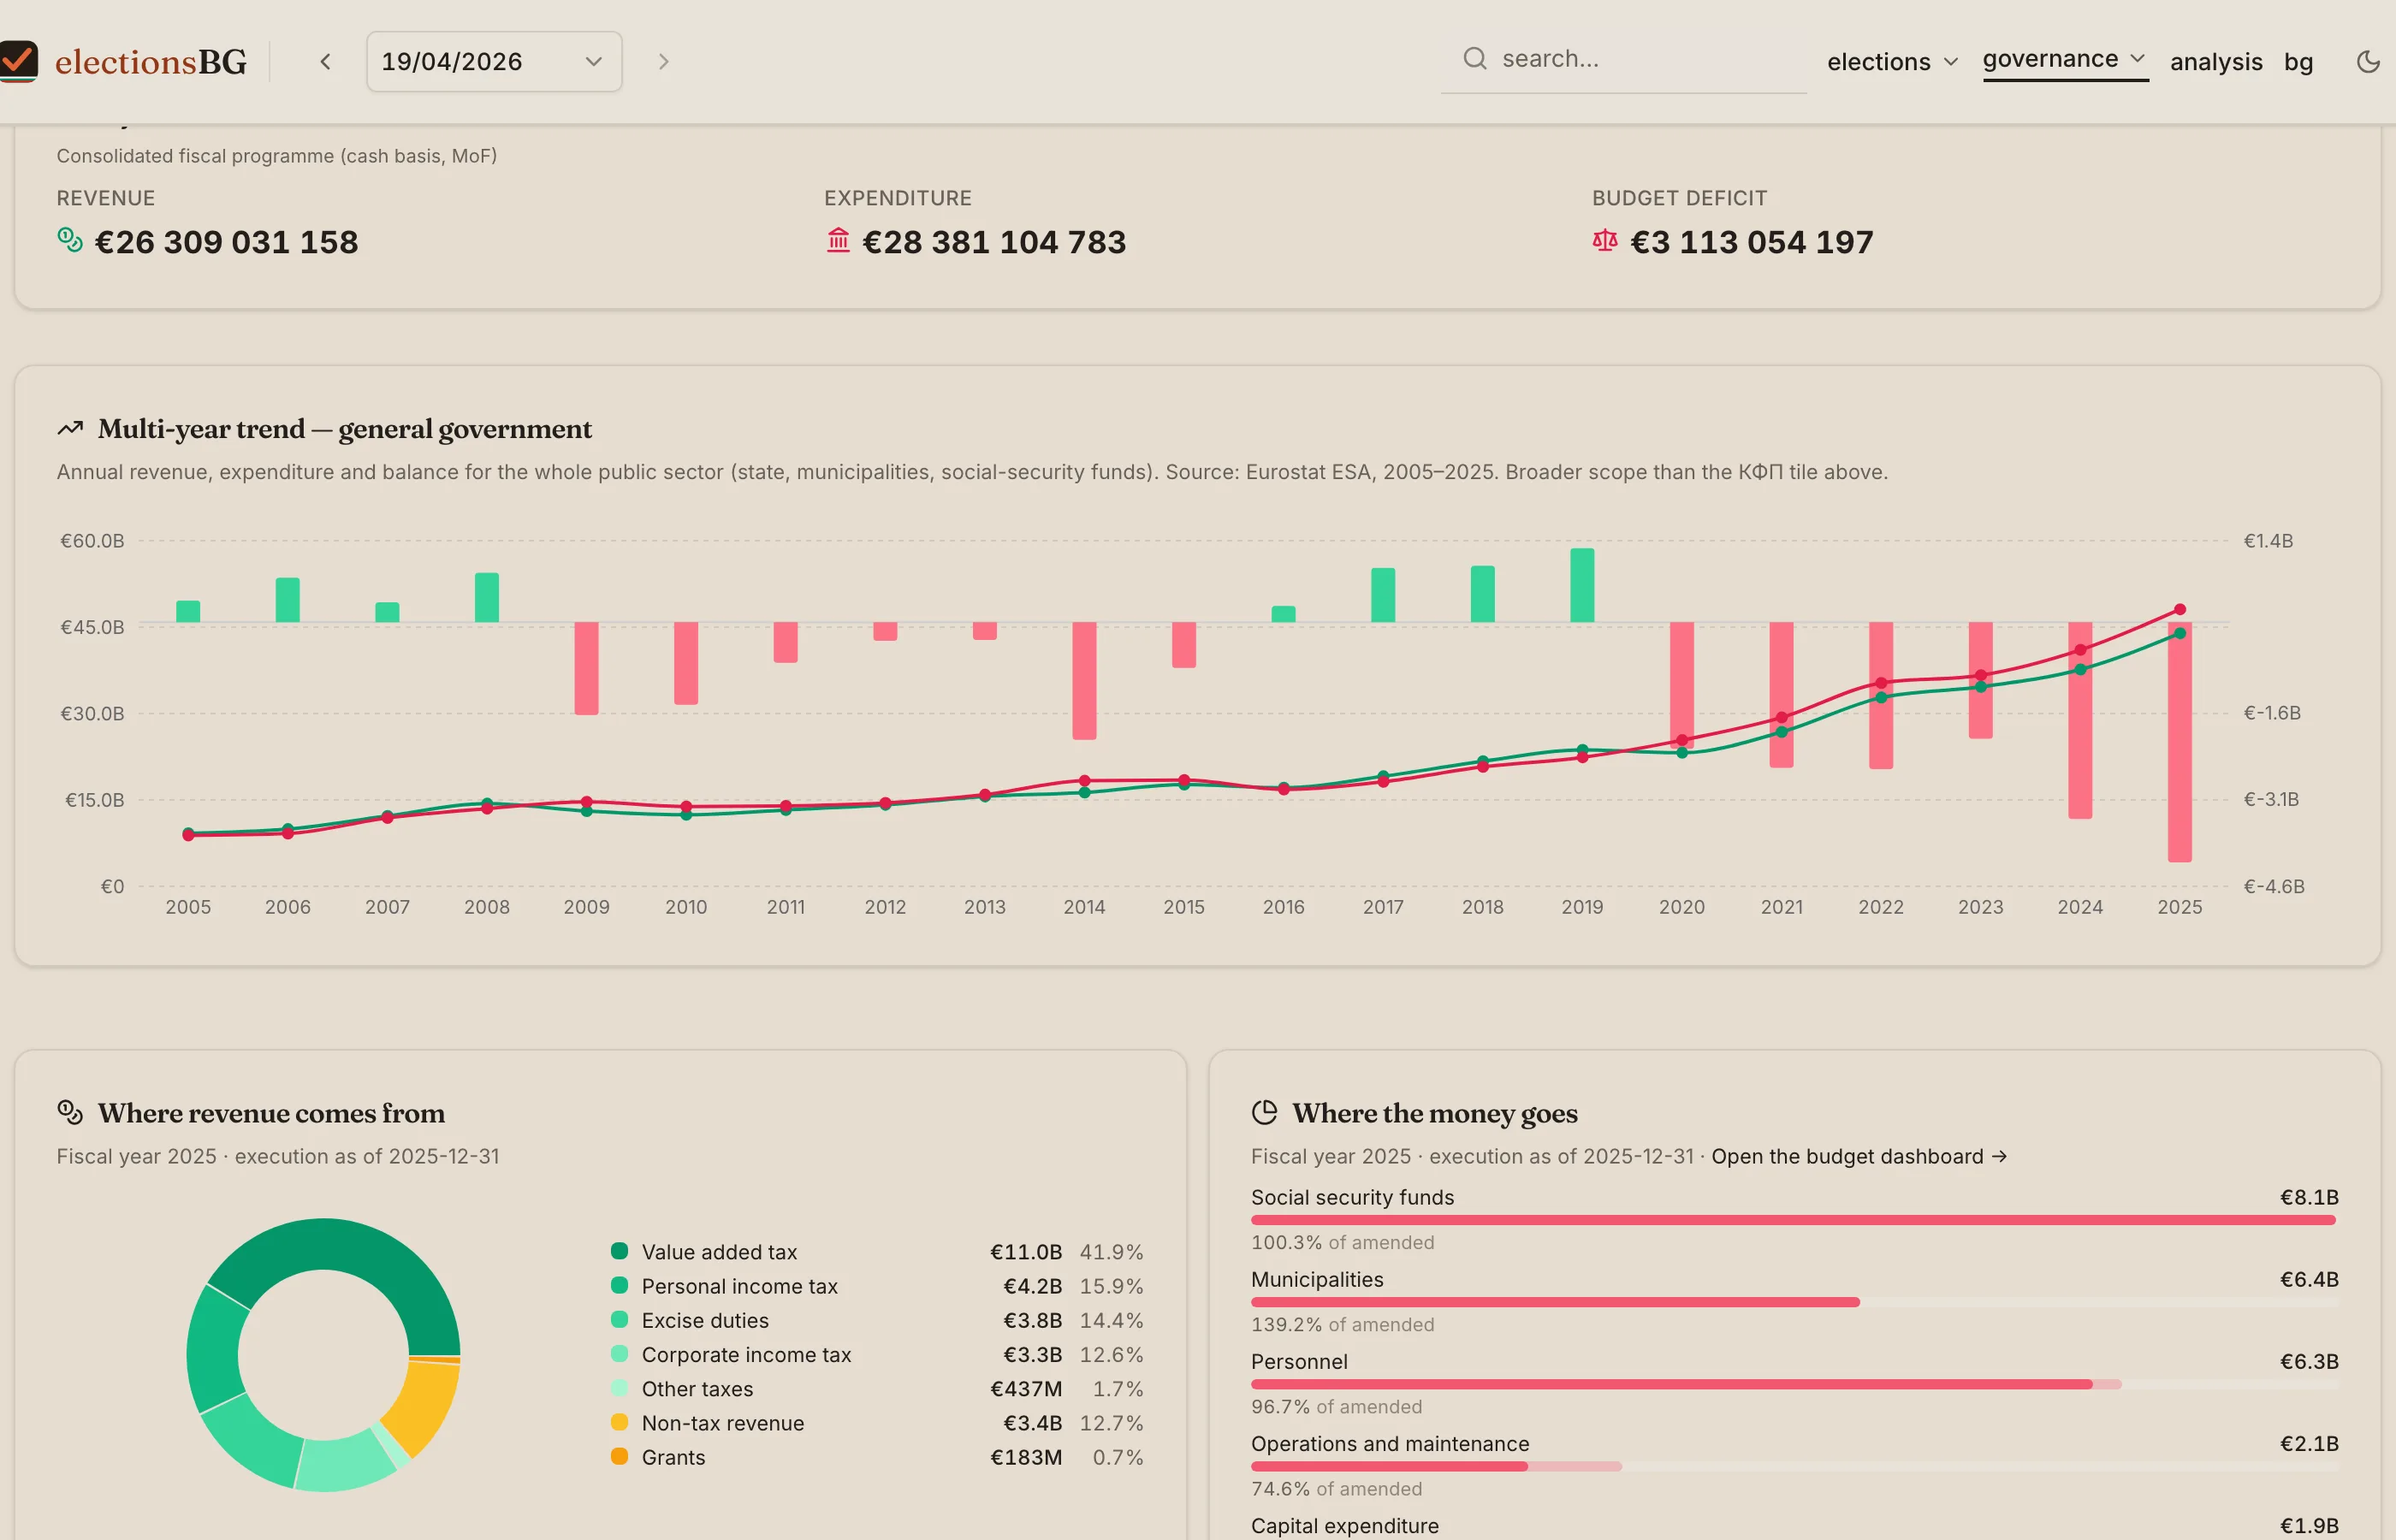
The KФП summary tile and the general-government trend tile use different scopes (cash basis vs accrual, state-only vs whole public sector); both now carry explicit scope labels so the numbers do not look like they contradict each other. The revenue composition tile underneath shows where the money comes from (VAT > personal income tax > excise duties > corporate income tax), and the expenditure composition mirrors it.
First 2026 print. The КФП snapshot for 31 March 2026 shows €5.46bn in cumulative cash revenue against €7.38bn in expenditure, or a €1.92bn cash deficit at the quarter mark. Cash budgets run seasonally (corporate-tax receipts cluster later in the year, EU transfers are uneven), so a Q1 deficit on its own is not a signal. The relevant frame is comparative: full-year 2025 closed at a €6.09bn cash deficit, so roughly a third of that has already been booked in the first three months — a pace the dashboard will track month over month to see whether it normalises in H2.
Where to look: the State budget section.
Tally
| Bucket | High | Medium | Low | Total |
|---|---|---|---|---|
| Risks | R1, R2 | R3, R4, R5 | R6, R7 | 7 |
| Opportunities | O1, O2, O3 | O4, O5, O6 | — | 6 |
Three of the seven risks are structural (R1 cabinet churn, R2 trust deficit, R3 WGI decline) — they will not resolve on their own. Three of the six opportunities are time-sensitive (O1 fiscal room, O2 macro window, O3 EU integrations) — the window is open but not for long.
The other three of each side are observation surfaces, not standalone problems or solutions: R5/R6/R7 and O4/O5/O6 describe what is now visible rather than what must immediately change. The dashboard's job is to keep them visible. The choice of what to do with that visibility belongs to the cabinet, the parliament, and the voter.
Where to go next
- Governance dashboard — live values for everything above, updated as new data lands.
- Indicators page — full macro time series, the debt-emissions table, and inflation breakdowns.
- MP connections article — the source piece behind R6.
- Procurement article — methodology behind R5.
- Observations page — every OSCE/ODIHR mission since 2005.
The scorecard will be refreshed when major data updates land — new annual WGI, fresh OSCE final report, a new cabinet ending, or a debt issuance that resets the yield trend.